The Biggest Loss Ever

The S&P Biotechnology Select Industry Index (XBI) just experienced its worst drawdown ever. The 38.9% decline since July of 2015 (slightly worse than the fall in 2008) is unlike anything these investors have ever witnessed.

xbi

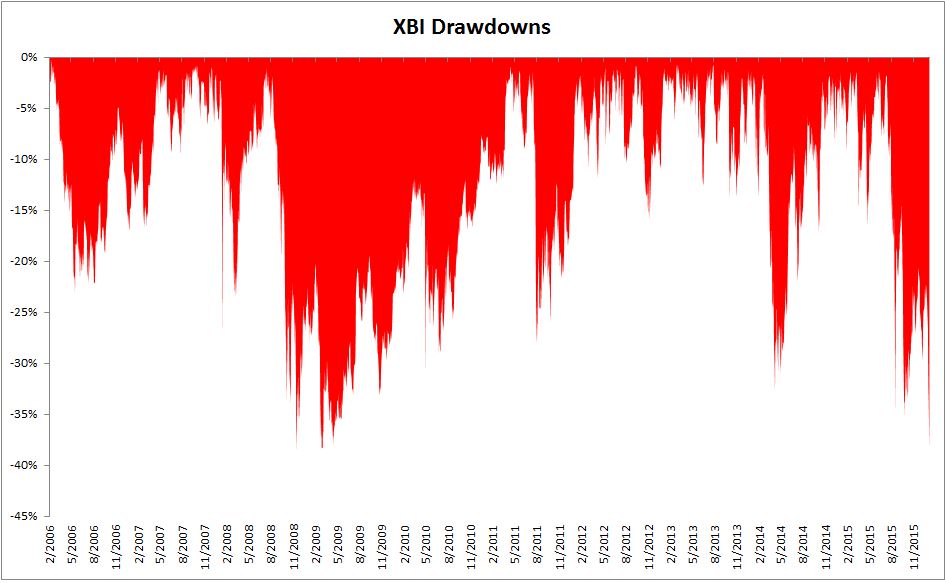
While the carnage going on in these stocks is ugly, these charts only show the losses over time, as if there is not a mirror image to these drawdowns. We’re assuming investors held on through the losses, we might as well assume they stuck around for the gains.

The chart below is a more accurate look at the experience a buyer would have had if he or she bought XBI on the first day it started trading.

xbi 2

The hypothetical biotech investor would have been in a 10% drawdown 51% of the time and in a 20% drawdown 25% of the time. For this pain they would have experienced a 257% return over the next decade, compounding their wealth at 13.7% a year. Granted, there might be one or two people alive that actually bought on day one and still own it today, but the point remains.

Biotech investors, and investors in general have been well compensated for the multiple large drawdowns they’ve experienced. No pain, no gain.

This content, which contains security-related opinions and/or information, is provided for informational purposes only and should not be relied upon in any manner as professional advice, or an endorsement of any practices, products or services. There can be no guarantees or assurances that the views expressed here will be applicable for any particular facts or circumstances, and should not be relied upon in any manner. You should consult your own advisers as to legal, business, tax, and other related matters concerning any investment.

The commentary in this “post” (including any related blog, podcasts, videos, and social media) reflects the personal opinions, viewpoints, and analyses of the Ritholtz Wealth Management employees providing such comments, and should not be regarded the views of Ritholtz Wealth Management LLC. or its respective affiliates or as a description of advisory services provided by Ritholtz Wealth Management or performance returns of any Ritholtz Wealth Management Investments client.

References to any securities or digital assets, or performance data, are for illustrative purposes only and do not constitute an investment recommendation or offer to provide investment advisory services. Charts and graphs provided within are for informational purposes solely and should not be relied upon when making any investment decision. Past performance is not indicative of future results. The content speaks only as of the date indicated. Any projections, estimates, forecasts, targets, prospects, and/or opinions expressed in these materials are subject to change without notice and may differ or be contrary to opinions expressed by others.

The Compound Media, Inc., an affiliate of Ritholtz Wealth Management, receives payment from various entities for advertisements in affiliated podcasts, blogs and emails. Inclusion of such advertisements does not constitute or imply endorsement, sponsorship or recommendation thereof, or any affiliation therewith, by the Content Creator or by Ritholtz Wealth Management or any of its employees. Investments in securities involve the risk of loss. For additional advertisement disclaimers see here: https://www.ritholtzwealth.com/advertising-disclaimers

Please see disclosures here.