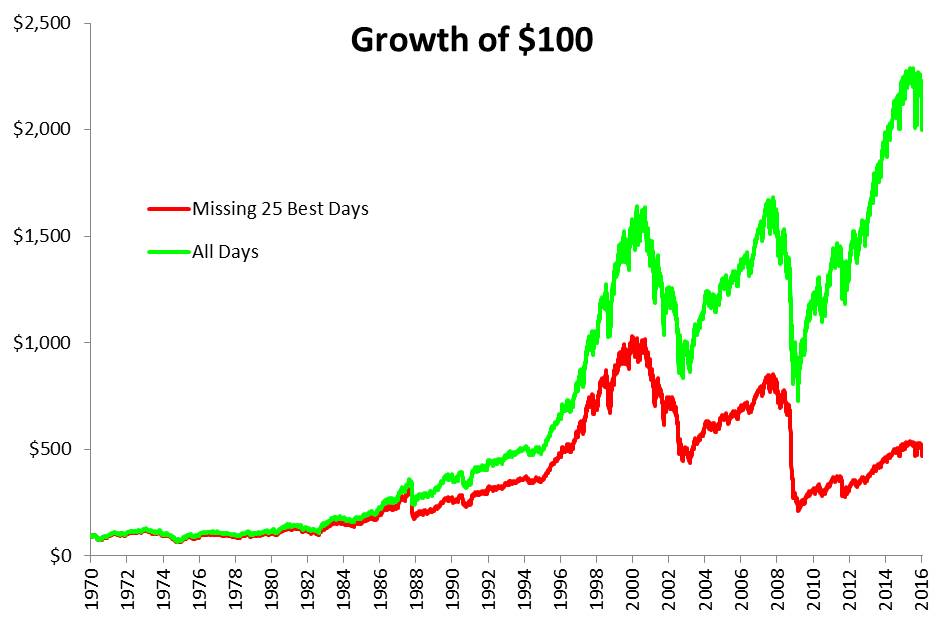
“Time in the market, not timing the market” is the rallying cry for buy and hold investors. Charts like the one below show the damage an investor would have done if they missed out on just the best 25 days (out of 11,620) since 1970. If you somehow managed to do this, your returns would have gone from 1910% down to 371%, or 6.7% a year down to 3.4%. To give you an idea how lousy that is, one-month U.S. T-Bills returned 4.9% over the same period.
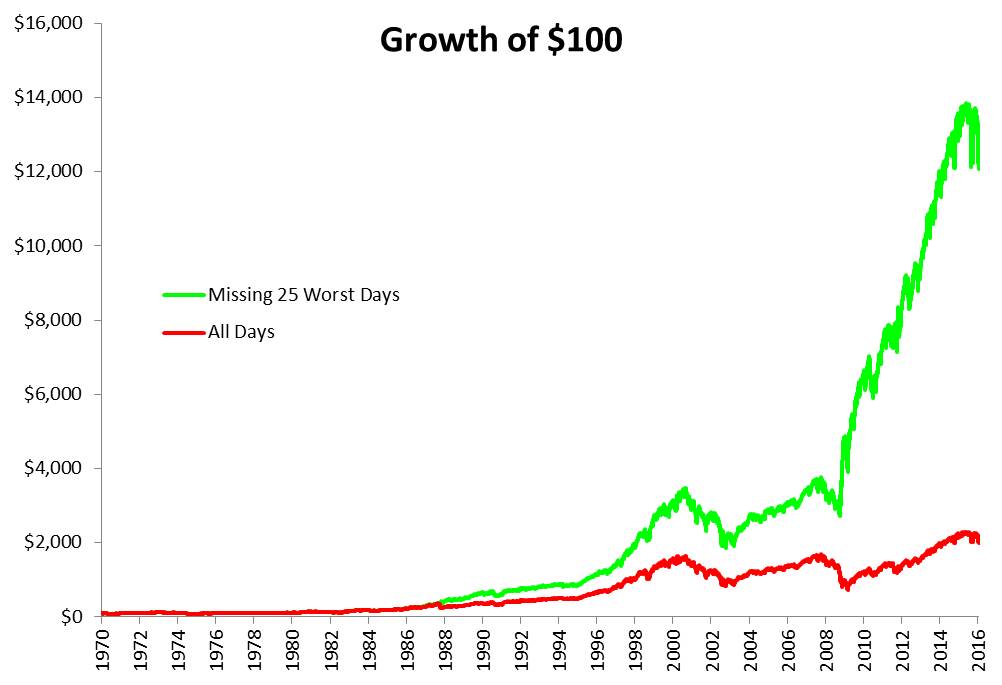
More active participants, can make the claim, “if you’re going to show missing the 25 best days, why not show missing the 25 worst days?” That’s a fair statement as missing the 25 worst days is equally as unrealistic as missing the 25 best. In the chart below, you’ll see that the wizard who dodged these 25 days would have gained 12,045%, or 11% a year.
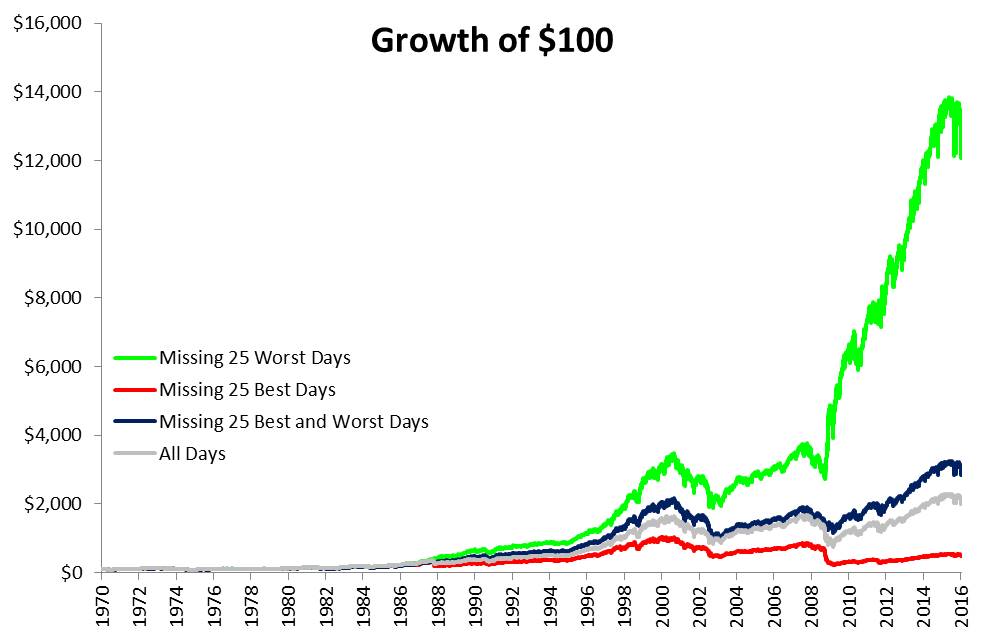
But what if an investor avoided the 25 best and 25 worst days?” This returned 2750% versus the 1910% earned from the buy and holder.
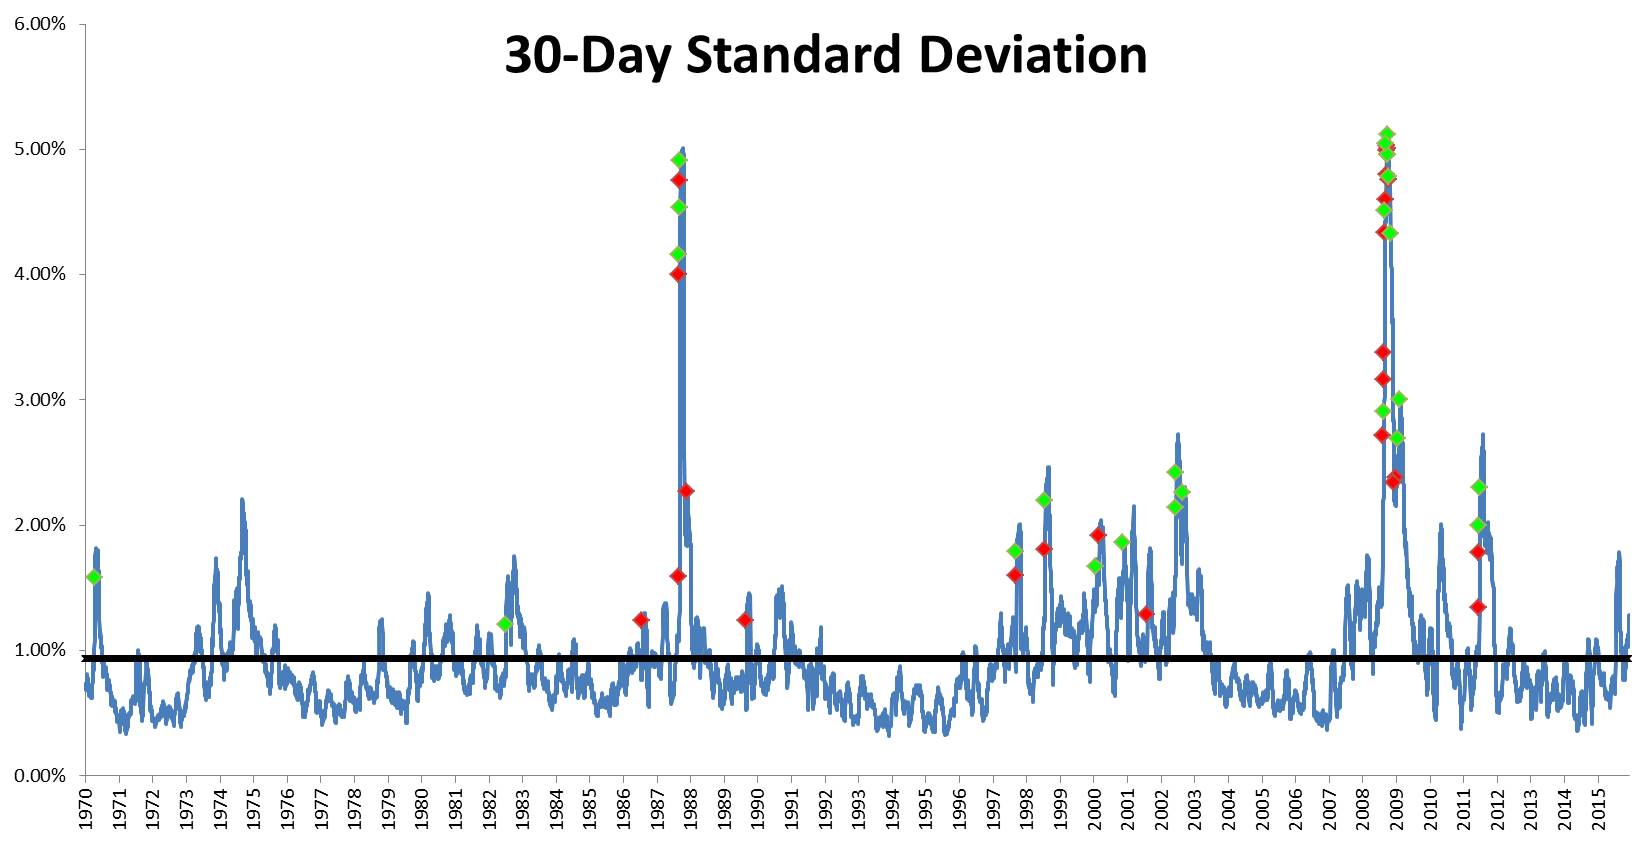
I’m not suggesting it’s easy or even possible to achieve this, but there is something interesting about the best and worst days. In the chart below, we can observe that these days tend to cluster (The green dots represent the 25 best days and the red dots represent the 25 worst days). Furthermore, they cluster during volatile markets. All fifty of these days occurred when volatility was above average (the black line).
Some of the best traders will do less when volatility picks up. Sure they’ll miss a lot of the best days, but if they can miss the best and worst days, then maybe that’s an endeavor worth pursuing. The most important thing, whether you’re attempting to time volatility or attempting to sit through it, is to understand the risks inherent in whatever you’re doing.
Michael Batnick is a managing partner at Ritholtz Wealth Management. He is the co-host of Animal Spirits, What Are Your Thoughts, and The Compound and Friends. For disclosure information please see here.
Get a Full Investor Curriculum: Join The Book List
Every month you'll receive 3-4 book suggestions--chosen by hand from more than 1,000 books. You'll also receive an extensive curriculum (books, articles, papers, videos) in PDF form right away.