The S&P 500 closed at a 52-week low on January 20th for the first time since 2011. Last week I took a look at how stocks did in the year they made a 52-week low. Maybe not surprisingly, they performed significantly worse in the years when a 52-week closing low occurred, returning -10% on average, versus 18% for all years that didn’t experience this. Today, I’m going a step further to examine how stocks performed in the one and three years following a 52-week closing low.
When looking out only one year, it’s almost always impossible to say anything conclusive. and this exercise is no exception. With that said, here are a few observations.
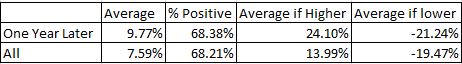
- Stocks have historically not been any more likely to be positive one year after they’ve made a 52-week closing low. However, when stocks were positive one year later, the average change was 24%, significantly higher than all periods.
- Following the previous statement, after closing at a 52-week low, stocks were more likely to have an outsized move a year later. For all one-year periods, stocks closed either +/- double-digits 65% of the time. One year after a 52-week closing low, stocks had a double-digit change 75% of the time. Grab your popcorn.
Contrary to what our stomach would have us believe, stocks actually get less risky as they decline. For long-term investors that are working and buying stocks every two weeks, these declines should be thought of as “a gift from god” (H/T Nick Murray).
I usually stay pretty far away from predictions, but here’s something I feel 86% certain about; stocks will be higher three years from now. That’s what has happened historically following a 52-week closing low, so I’m going to go with that. I’m also 74% certain that the S&P 500 won’t be more than 10% lower than the recent 52-week closing low one year from now. If you want to hold my feet to the fire, that’s 1,673 to be exact. What’s giving me the confidence to say that? Of the 427 52-week closing lows since the late 1920s, stocks were 10% lower one year later just 24% of the time. Furthermore, the last few times stocks were 10% lower one year after making a 52-week closing low were 1973, 1974, 2000, 2001, 2008. Unfortunately, we can’t rule out the possibility that this turns into one of those markets, especially if you look at the way banks- in particular European ones- are behaving.
The more research I do into market history, the more I realize that all bets are off, especially when you’re talking about a twelve-month period. It’s scary to come to this realization but the fact of the matter is we have no idea what the future holds. While it’s true that stocks have been higher three years after a 52-week low 86% of the time, there is simply no way of knowing if we’re currently in the 14%. Because of the permanent uncertainty in markets, it’s so important to have an investment plan in place. Market returns are beyond our control, but having an answer to all environments, even if that answer doesn’t immediately yield positive returns, is a very liberating feeling.


Great background info. I’m 67% most statistics are made up on the spot. Just kidding. I enjoy your articles.