“One day it started raining, and it didn’t quit for four months” Forrest Gump
What’s especially frustrating right now, besides the fact that the S&P 500 is now in a 13.2% drawdown, is that we’re not seeing any sense of panic. While every bounce attempt is getting smaller in both size and duration, the market has yet to do the proverbial flush that we all seam to be waiting for. The “all clear” moment, if you will.
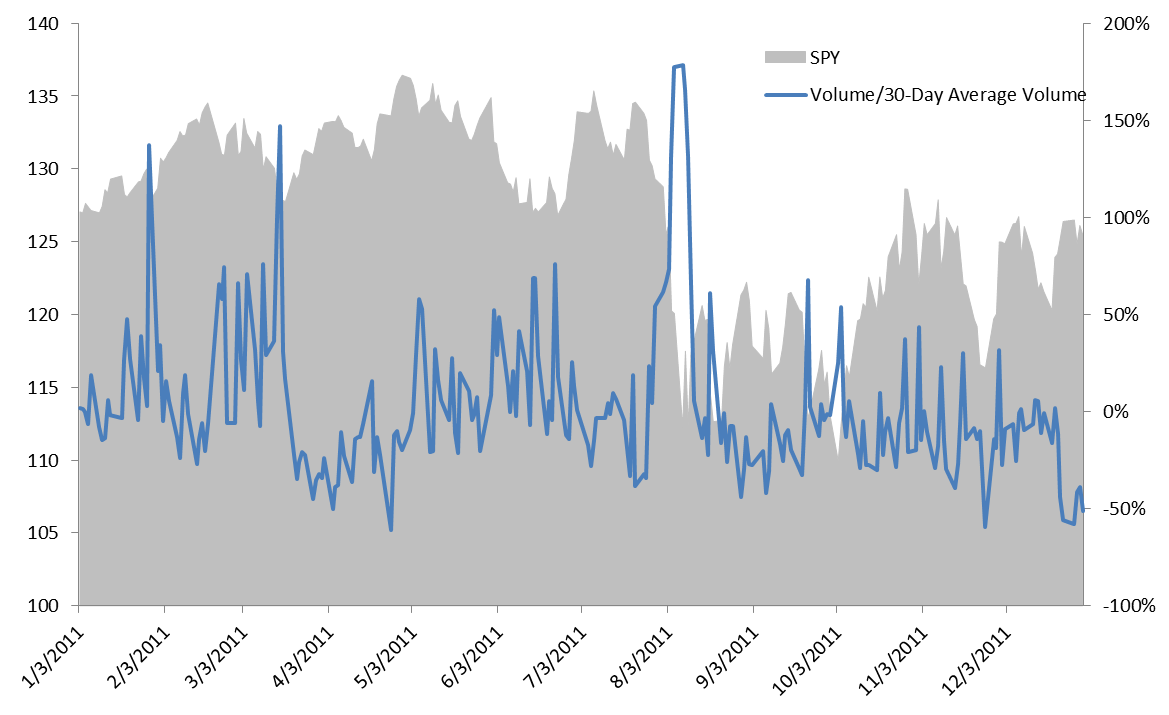
The last time stocks were selling off like this was the summer of 2011 when the S&P 500 fell 21.58% peak to trough. But do not, I repeat do not call this a bear market, because using closing prices it “only” fell 19.39%. GMAFB. Anyway, that episode did end in the type of “get me out” selling. In the chart below, SPY is shown in gray while the blue line represents the daily volume divided by the 30-day average volume. You can see that the spike in coincided not exactly at the bottom, but pretty darn close. The volume was more than twice as much as the 30-day average for five days in a row and believe it or not, this is the only time this ever happened.
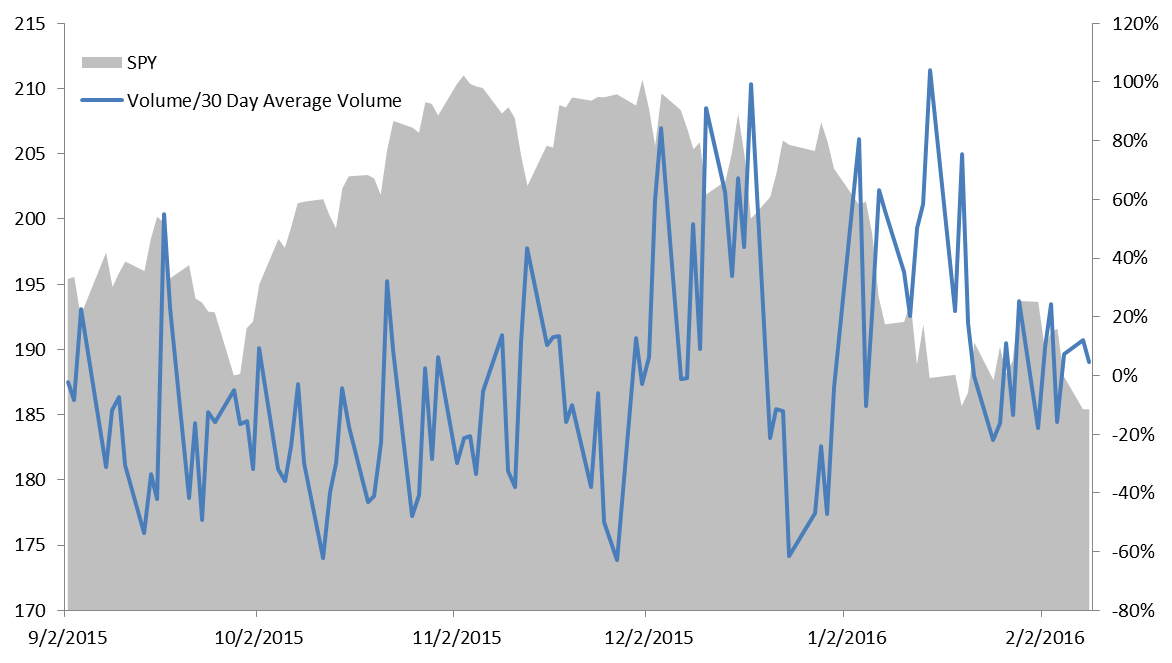
Right now on the other hand, we’re seeing zero signs of capitulation. Again, SPY on the left axis, volume relative to 30 day volume on the right.
Maybe we will get the flush or maybe we won’t. Maybe we get a flush, consolidation, then more flushing. Who knows? There is no formula for markets like this, which is what makes it so fascinating to watch. In the short term, fundamentals mean literally nothing and lines in the sand are drawn and erased daily. Psychology takes over and selling begets more selling until….”and then just like that, somebody turned off the rain and the sun came out.”
Michael Batnick is a managing partner at Ritholtz Wealth Management. He is the co-host of Animal Spirits, What Are Your Thoughts, and The Compound and Friends. For disclosure information please see here.
Get a Full Investor Curriculum: Join The Book List
Every month you'll receive 3-4 book suggestions--chosen by hand from more than 1,000 books. You'll also receive an extensive curriculum (books, articles, papers, videos) in PDF form right away.