The S&P 500 is now positive in February, after being down 6.7% earlier in the month. Although this slight gain can quickly evaporate- and has as I’m typing- I wanted to see if a theme emerged when stocks acted this way.
Before diving into the data, what I guessed I might find was that this behavior tended to occur in down trends (not necessarily true), and that these type of months were more likely than a random month to mark a short term bottom (not at all true).
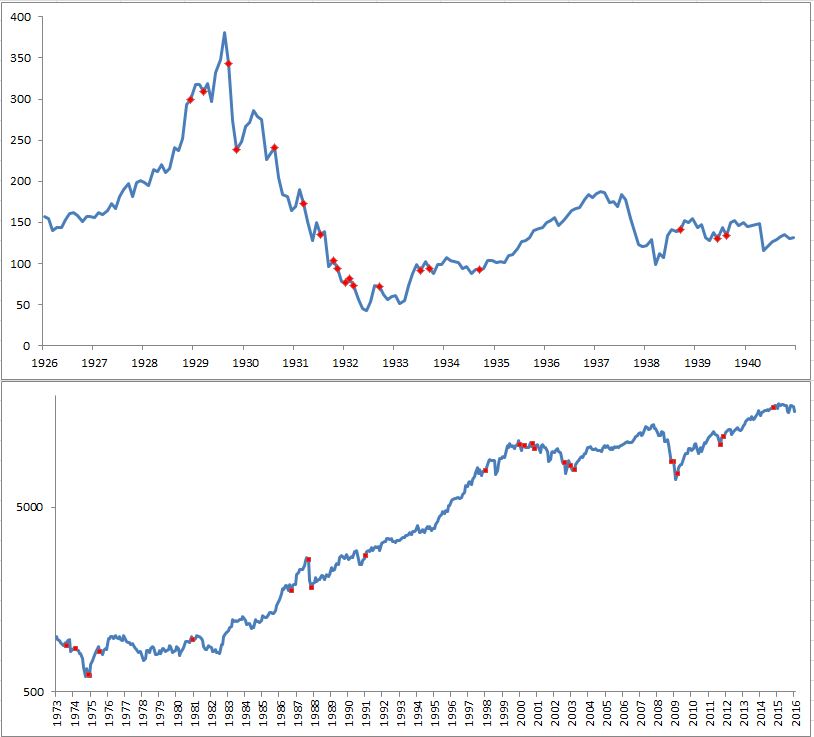
For the sake of available data, I’m going to use the Dow for this exercise. Below, the red dots indicate every time the Dow fell 5.8% and finished the month positive. Since 1926, this has happened 43 times, unfortunately not exactly a huge sample (there is a thirty year gap between the charts because this type of month did not occur between 1940 and 1972).
There are a few really interesting things that emerged from this analysis that are worth pointing out.
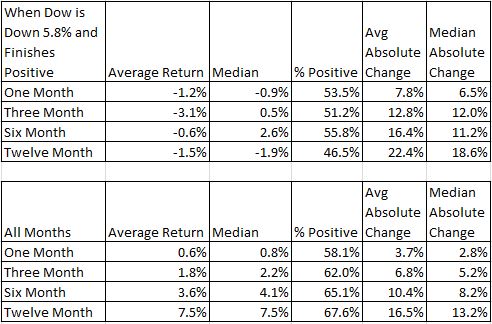
The average one, three, six and twelve month returns are all negative.
The likelihood of stocks being positive are lower than normal across the board, particularly twelve months out.
The moves following these type of months have been enormous. The average absolute returns are just about double the normal returns.
The past data alone doesn’t tell us anything about what will happen this time, but to sum up- following months that are down a lot and finish positive, stocks were higher one, three, six and twelve months later about 50% of the time, with an increased probability of a larger than normal move.
Michael Batnick is a managing partner at Ritholtz Wealth Management. He is the co-host of Animal Spirits, What Are Your Thoughts, and The Compound and Friends. For disclosure information please see here.
Get a Full Investor Curriculum: Join The Book List
Every month you'll receive 3-4 book suggestions--chosen by hand from more than 1,000 books. You'll also receive an extensive curriculum (books, articles, papers, videos) in PDF form right away.