Nick Murray once said “if you want to suppress volatility, you will suppress returns.” This definitely applies to many investors who either try to time the market on their own, or turn to complex and often times dangerous strategies designed to deliver stock like returns with bond like risk. Such a strategy by definition, cannot deliver on its promise. Look no further than the Merrill Lynch structured notes that lost 95% of its value. And although complex products almost never live up to their promise, there are simple ways to lower volatility without losing your shirt.
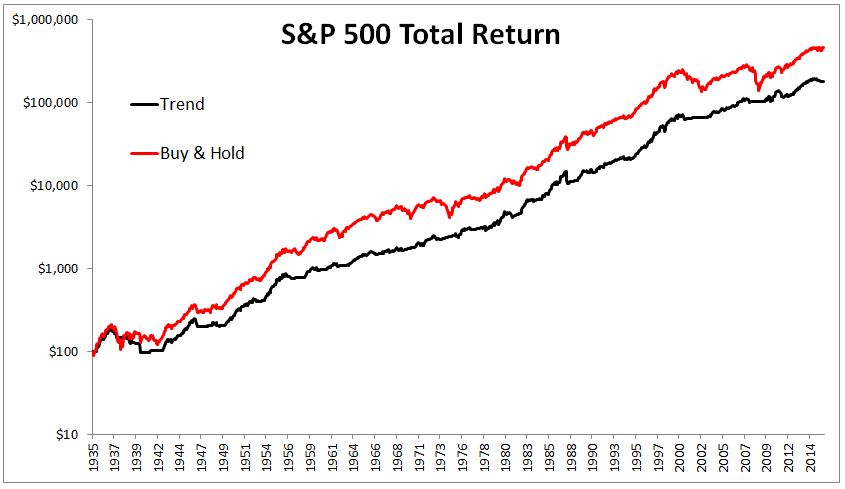
Consider a strategy that is over the top in its simplicity; if the S&P 500 is higher than it was one year ago, own the index. If the S&P 500 is below where it was one year ago, switch to one-month t-bills. You can see in the chart below that this simple model did significantly better than the S&P 500.
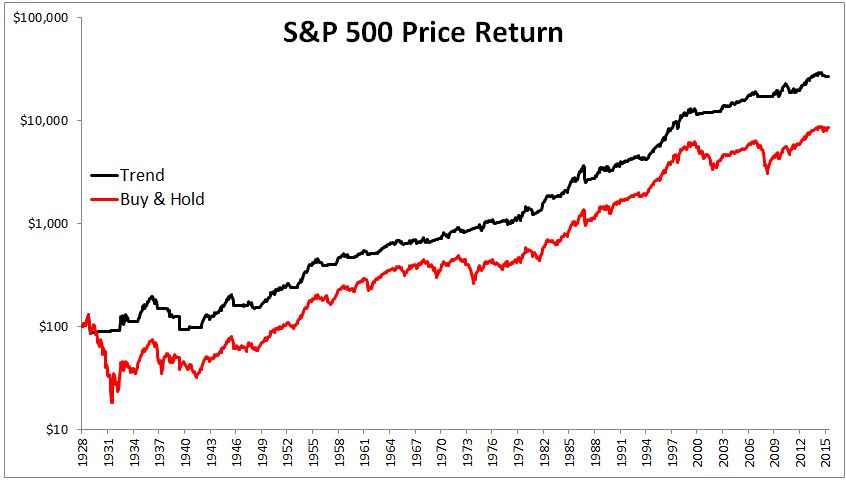
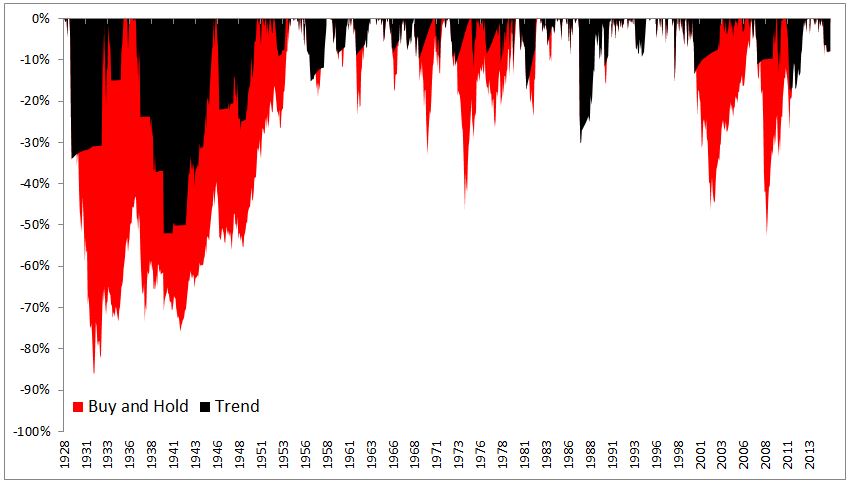
The trend model also experienced less severe drawdowns. It would not have saved investors from every dip, but it did okay- falling just 13% in the tech wreck versus 46% for the S&P 500, and 11% in the financial crisis versus 53% for the S&P 500. Furthermore, the standard deviation of the trend model was 12.4%, compared with 18.8% for the S&P 500.
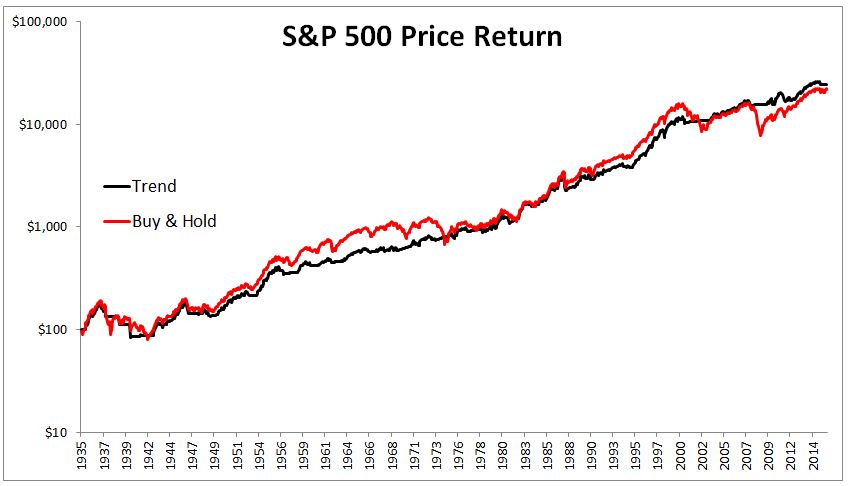
Much of the advantage earned by the trend strategy came in the first few years by avoiding some of The Great Depression. If we change the start date to 1935, the picture looks much different. This time, the gap between the buy and hold strategy and the trend model shrinks dramatically.
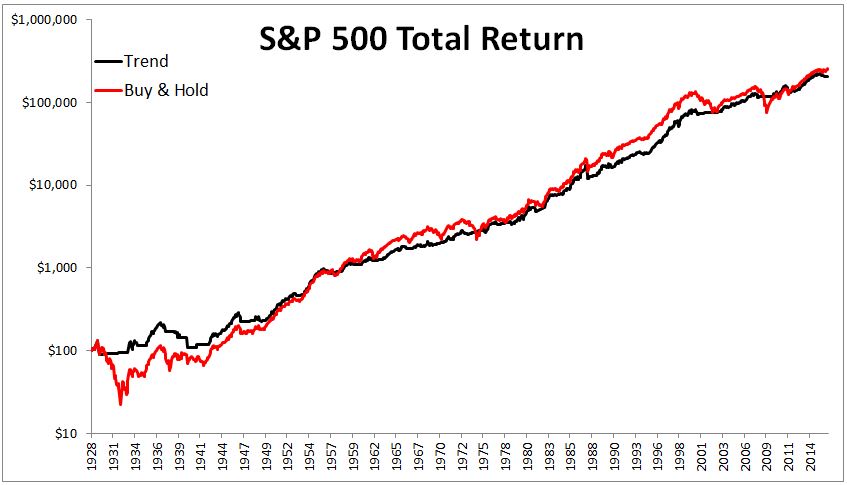
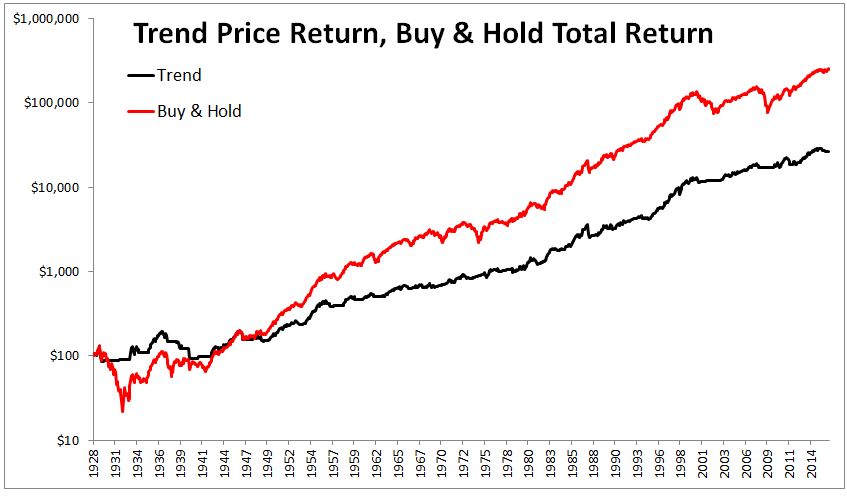
But of course, as you’re already probably thinking, price appreciation doesn’t tell the whole story.The return of the S&P 500 total return index from 1928-today is 2838% higher than just the price return. So, if used the S&P 500 total return index, buy and hold actually did better than the trend model. Any downside that the trend strategy avoided was more than offset by the dividends they missed while not invested in stocks.
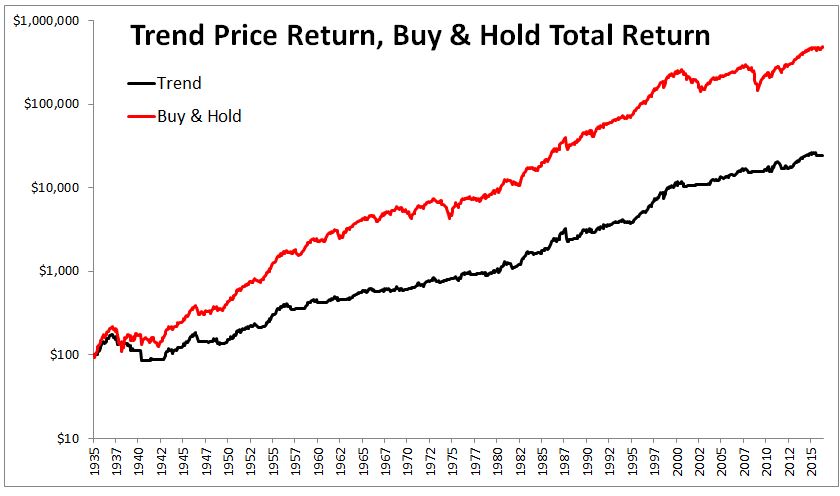
Similarly with the first example, if we begin in 1935 instead of 1928, the buy and hold portfolio significantly outperformed the trend model.
Okay, we’ve made a lot of assumptions so far. 1) That indexes existed prior to the early 1970s, which they didn’t, and 2) that investors don’t have to pay taxes on their gains, which they do. This is far from exact, but I’m going to make another assumption; That the taxes the trend model did not pay were equal to dividends not received. So below, I’m using the S&P 500 total return index for the buy and hold strategy versus a trend model that used price only. In this case, the buy and hold strategy returned 9.37% while the trend model returned just 6.6%.
Again, starting in 1935 rather than 1928, the advantage swings wildly to the buy and hold strategy.
People will draw their own conclusions from the charts above, but what I’m trying to do here is show a simple example to make the following point; investors often view active versus passive as black or white, all or nothing. But it need not be this way. Active and passive strategies can be combined to improve an investor’s experience. And while it’s probably true that a tactical model will suppress returns, if it can suppress volatility and help someone stick with their plan, then its importance to long-term returns cannot be overstated.
Investors usually think about diversification as owning different asset classes, but owning different strategies can be just as important. Having a good tactical model can help an investor’s behavior, which is the ultimate predictor of long-term returns.

