For the last 35 years, the classic 60/40 portfolio returned 10.5% a year. It’s hard to imagine that these results will be matched over the next 35 years, which has a lot of people looking to alternative ways of managing a portfolio. Today I’m going to examine one of these alternatives, the “Permanent Portfolio,” which was outlined in William Bernstein’s “Deep Risk” (and elsewhere). The Permanent Portfolio consists of 25% of each of the following:
- U.S. Stocks (S&P 500)
- Cash (One-month t-bills)
- Long-Term Government Bonds
- Gold
Let’s get this out of the way early- these results are hypothetical. For one thing, they assume no transaction costs. Also, before the advent of GLD, retail investors were only able to purchase Gold at a significant markup. If you can accept this and not rip your hair out, let’s proceed.
Below is the growth of $1 since 1976. The 60/40 portfolio compounded at 10.13% for a total return of 5,050%. The permanent portfolio compounded at 8.4% for a total return of 2,600%.
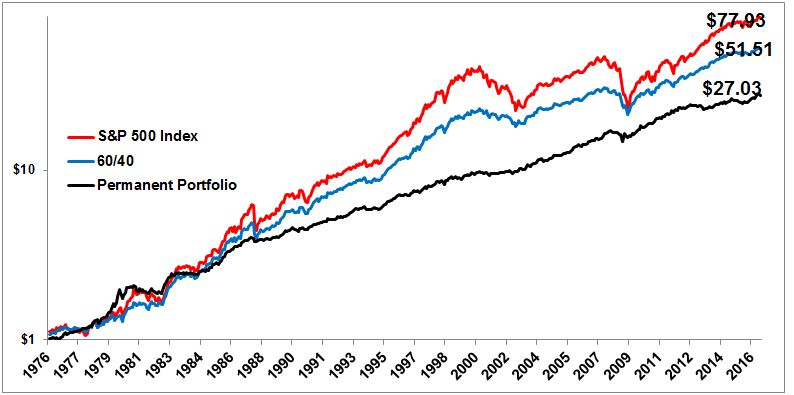
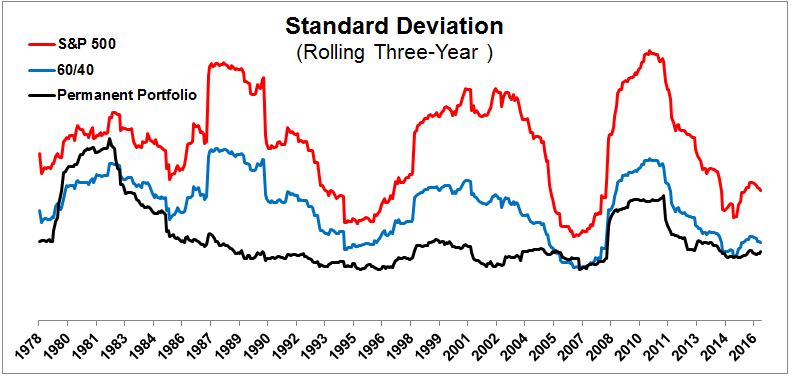
While the permanent portfolio did not keep pace with either stocks or a 60/40 portfolio, which is to be expected, the ride was much smoother. The standard deviation of returns was 14.9 for stocks, 9.6 for a 60/40 portfolio, and just 7.2 for the Permanent Portfolio.
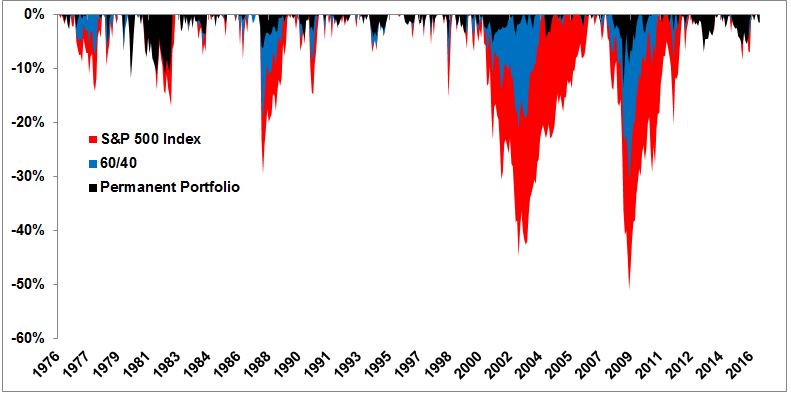
The biggest appeal for somebody who would choose the Permanent Portfolio are the drawdowns, which were much more shallow than the 60/40 portfolio. In October 1987, the Permanent Portfolio fell just 4.5% while the 60/40 portfolio fell 13.4%. After the tech bubble burst, the deepest drawdown for the Permanent Portfolio was just 5%. Stocks got cut in half and the 60/40 portfolio declined as much as 21%. In the aftermath of the financial crisis, the worst it got for the Permanent Portfolio was -13%; the 60/40 portfolio fell more than 30%.
The benefits of the Permanent Portfolio are pretty clear, but the biggest challenge I see are the mental and emotional peaks and valleys. Below is the difference between the Permanent Portfolio and the S&P 500 over twelve month periods. Green is when the Permanent Portfolio outperformed and red is when it underperformed. Stocks might not be the appropriate comparison, but I’m using them because they represent regret, or what “could have been.”
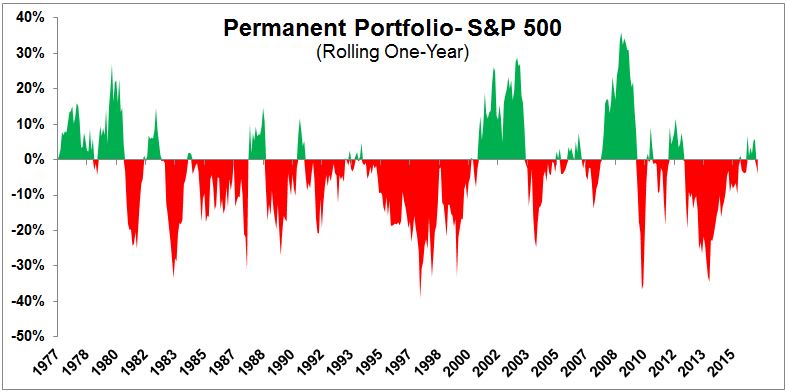
The permanent portfolio has an us vs them mentality and when “they’re” winning, it can take a real toll on your psyche. I’m not suggesting it’s easy to stay in stocks as they’re falling 20%, 30%, 40% and more, but there is something incredibly true about the phrase “misery loves company.” I can’t prove this, but I’d imagine it’s more difficult to go through prolonged periods of underperformance while the rest of the world is singing Kumbaya than it is to stay in stocks through a bear market. In the three years from March 1995-March 1998, the S&P 500 rose 134% while the Permanent Portfolio rose just 36%. It would have taken an almost inhuman amount of discipline to have stayed the course.
I have little bad to say about the actual construction of the Permanent Portfolio; I can think of far worse ways to manage your money. The biggest potential problem is that sitting through underperformance is very difficult, which is obviously true of anything other than a plain-vanilla index. But if you think you’re able to stay invested in this model through thick and thin than you’d find yourself far ahead of most investors out there.
Source:

