“Strange things happened near the boundaries”- James Gleick
Stocks are not cheap. The CAPE ratio is 28.46, above the long-term average of 16.73 and more expensive than 96% of all readings. But exactly how expensive are they, and what might this mean for future returns?
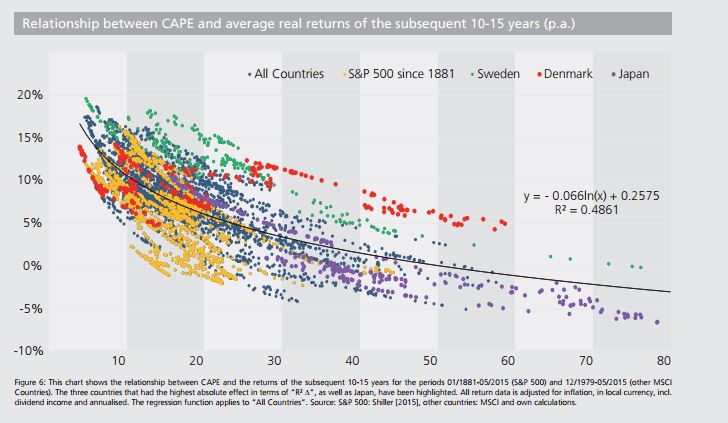
The chart below from Star Capital shows that the more expensive stocks are, the deeper the average drawdown. Also note that terrible losses are not limited to expensive markets; Cheap can get significantly cheaper.

Whether you choose the CAPE ratio or a different valuation metric, they all say the same thing; Expensive markets leave investors with a smaller margin for error. The more you pay, the less you get. The table below shows this relationship quite nicely.
Data for the CAPE ratio in the United States goes back to 1881. But the CAPE ratio wasn’t even thought of until 1934 (Ben Graham), and it certainly didn’t go mainstream until just recently. Ben Carlson said “The fact that we now have data that wasn’t available in the past changes the nature of that past data.” This is such a great point. Today we know that the average CAPE ratio going back to 1881 was 16, but that long-term average isn’t static, it changes over time as new information enters the data series.
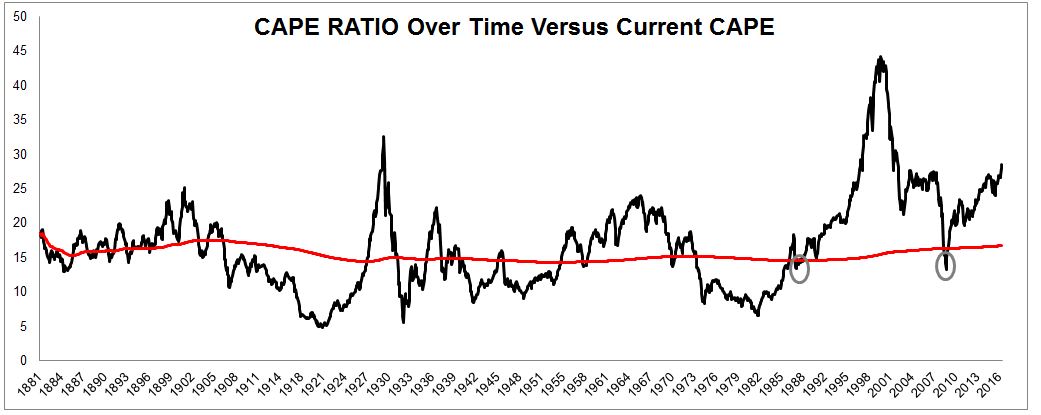
The chart below shows how the average CAPE ratio changes over time and you can see that it has been rising for the last 30 years, which I’ll get into in just a minute.

Jumping in or out of stocks based on valuation can be extremely difficult, if not completely impossible. The chart below plots the current CAPE ratio against its long-term average (at the time). It was last below it for a brief moment in 2008 and before that, you had to go back to 1988!
The CAPE ratio, among other valuation metric is high, but allow me to give a few possible explanations for why valuations have been drifting higher for the last thirty years. I can already hear the eyeballs rolling, “oh, I guess this time is different.” Hold on, I am not suggesting that valuations and stocks can’t get cut in half. I am also not suggesting that this will continue indefinitely, I’m just trying to bring some balance to the “stocks are expensive, sell everything” crowd. Also, I will feel no shame if this post marks the top. Alright, here we go.
- We’re using data going back to 1881. Should $1 of earnings generated by Facebook be worth as much as $1 generated by Standard Oil, or Edison General Electric?
- America’s first billion dollar corporation was U.S. Steel. In 1902 they employed 168,000 people and had sales of $561 million or $3,340 in revenue per employee ($90,000 in today’s dollars.) Today, U.S. Steel’s revenue is $493,000 per employee, 5.5.x the amount it was in 1902.
- Companies are so much more productive and efficient than they used to be. Of the 52 S&P 500 companies that make this metric readily available, only one has sales per employee less than $90,000.Facebook is doing $2 million in revenue per employee, 22x the biggest company at the turn of the twentieth century.
- How much would you pay for $1 of suspected earnings when accounting laws didn’t exist?
- Reg FD, which mandates that all publicly traded companies must disclose material information to all investors at the same time, did not exist until 2000! Investors like transparency and are willing to pay a higher price for it.
- Interest rates are extremely low. People would rather accept volatility in stocks than low returns from bonds.
- In 1996 there were over 8,000 publicly listed companies. Today there are just 4,500. Perhaps people are putting a higher valuation on a shrinking number of public stocks.
- The 401(K) was’t created until 1981. Millions of Americans are buying stocks every two weeks in their 401(k) and these buyers are mostly price-agnostic, driving up the demand for stocks.
- The costs for trading have come down enormously over time. Schwab just cut their commissions to $7 per trade!
- In 1870 just 3% of the population was above sixty-five, and 94.5% of males were working. Retirement didn’t exist. Today, 13% of the population is over 65 and 60% of them are employed. These people are living longer and need to grow their wealth. The higher demand for stocks might be pushing multiples higher.
Looking at history, stock valuations appear to be way past the boundaries. But the average CAPE ratio for the last twenty years is 27, so maybe we’re not as close to the edge as the historical data would suggest. Either way, the question investors need to ask themselves is what to do with all this information, because there absolutely is a limit, a price at which stocks will be too high and will need to come down. The boundaries are always moving, so putting yourself in a position, right now, to weather the inevitable storm, is the key to capturing returns that the market has to offer.
Source:

