Today in market history, 2000:
The NASDAQ Composite hits its final all-time high. Over the next 31 months it will lose 78% of its value. pic.twitter.com/Kb9wIEZdhl
— Ritholtz Wealth (@RitholtzWealth) March 10, 2017
During the Russian financial crisis of 1998, the NASDAQ fell 33% from July through October, but during the final 58 days of the year, it shook off those losses and went vertical, adding 50%! This move was just the appetizer of what would become one of the most memorable entrées in all of financial history, 1999.
New highs were the theme of the year, here are some amazing statistics:
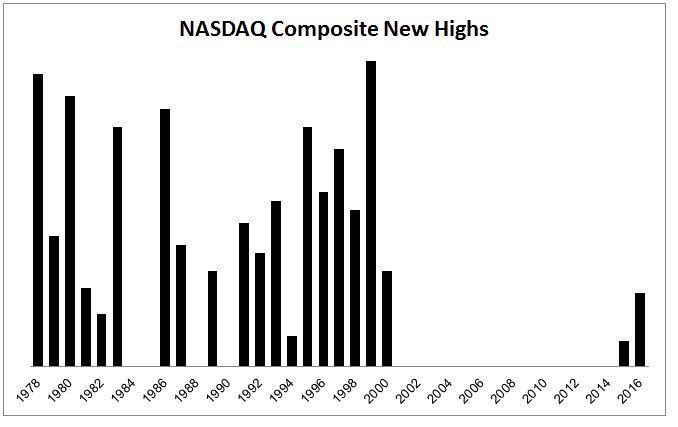
- The NASDAQ Composite experienced 70 new highs in 1999, or one every 3.5 days. Since then, it’s only had 45.
- It hit a new high every day in November except for the final two days.
- It hit a new high 20 straight days and gained 20% over that time.
- In the last 44 trading days of the year, it hit a new high 37 times.
Although it had the best year of any major index ever, there were a few shakeouts along the way. There were four separate 10% drawdowns. Each one likely felt like the end, but every time stocks just turned and kept going higher.

Needless to say, when stocks are going straight up, some funky things happen to valuations. In a Howard Marks memo from January 2, 2000, he wrote
“It is reported that the average new issue of 1999, which on average is probably about six months old, is selling roughly 160% above its issue price. For an example, The Wall Street Journal of December 8 described the case of Akamai, which went public on October 29 at a price of $26. It closed that day at $145, for an equity market value of $13 billion….Akamai’s price is $328 today, bringing its market capitalization to $29 billion. (By the way, in the first nine months of 1999, Akamai lost $28 million on $1.3 million of sales)
The gains were so concentrated, that AOL and Microsoft became more valuable than basically everything else.
“An analysis by Sanford Bernstein shows that on September 30, you could have bought America Online and Microsoft for $625 billion and gotten $25 billion of sales and $7 billion of earnings. Alternatively, for $635 billion you could have bought 70 industrial, financial, transportation and utility companies….and gotten $747 billion of sales and $43 billion of earnings.
The math on this one, wow.
“Priceline.com, which auctions off discount air tickets, (September quarter sales of $152 million, net loss of $102 million) has a market capitalization of $7.5 billion, while United and Continental Airlines ($7.1 billion sales, $469 million earnings) are worth a combined $7.3 billion.
But for every Priceline.com, Qualcomm (2,619%), Cisco (131%) and Yahoo! (265%), there were plenty of brand names that couldn’t find any buyers to save their lives. Here are a few of the companies whose stocks declined in 1999: Berkshire Hathaway (-20%), Kellogg (-10%), Coca-Cola (-13%), Ford (-9%), Bank of America (-17%), Hershey (-24%). Floyd Norris from the New York Times pointed this out, that the participation was thinning out:
“Indexes of stocks that are not so concentrated in technology have done much worse. While the Nasdaq composite is up 67 percent since Nov. 3, 1999, the day it first closed over 3,000, the Dow Jones industrial average is down 6 percent over the same period, and the Standard & Poor’s index of 500 stocks has risen just 3 percent.”
On March 10th, Norris presciently wrote:
VALUE is scorned and ignored. Money managers who pay attention to the traditional measures of valuation post horrible results and see customers flee. But even as value is disdained by the multitude, the seeds of its revival are being sown. This week’s debacle in Procter & Gamble, in which a moderate profit shortfall caused the maker of Tide and Crest to shed $40 billion in market value, may be a precursor of what will happen as other beloved stocks fall by the wayside.
But of course, some people didn’t see things this way, and understandably so. Who is the idiot, the person who warns that stocks are expensive for years while missing out on giant gainsK or the person who didn’t heed those warnings and doubled there money several times over?
That is not, it must be acknowledged, how a lot of people see it. James J. Cramer, the money manager and market commentator who is in the majority of investors who now treasure highflying technology stocks, sounded gleeful. ”If there is more risk in P.& G. than Broadcom or Brocade but much less reward, which are you going to be in?” he asked rhetorically in his column on TheStreet.com. ”All of that price-to-earnings flotsam and discount-to-normalized-earnings jetsam didn’t save you today.”
We know how the story ends; the NASDAQ crashes and takes 80% of its “value” with it. There were nine double-digit monthly losses and it would take 15 years before it would reclaim those levels.
It’s easy to look back and say that we’ve learned our lesson, but how easy is it to learn the wrong lesson? For example, one thing we learned from the tech bubble is to pay close attention to leadership, to be uber aware of indexes going higher without the majority of stocks following them. In 1999, the NASDAQ gained 86% while the Russell 2000 Value Index actually fell 1.5%. That is a divergence. Today, it feels like we’ve become too sensitive to them. In 2015, just a few stocks were responsible for all of the gains and many viewed this as the fly in the ointment. It wasn’t. And even today, nine of the ten biggest stocks are all within 3% of their 52-week highs, but if you go down the chain, the smaller stocks aren’t doing nearly as well. Is this the canary in the coal mine?
Each of these euphoric moments, and there have only been a few, have their own idiosyncrasies. So rather than dissecting what different stocks and different indexes did, we should instead focus on the behavioral side of things. And in that light, perhaps the most important lesson we can learn from 1999 is that bull markets can be responsible for more unforced errors than bear markets.
Source:
When the News Turns Bad, Valuation Suddenly Matters
THE MARKETS; Nasdaq Market at 5,000: Volatility as Way of Life

