Floating in outer space and looking down on earth, one would see a perfectly smooth, spherical ball. But zoom in and you’ll find valleys drilled thousands of feet into the surface, and mountains shooting miles into the sky. There is a world of difference between glancing at a map and traversing the terrain.
Likewise, looking at the growth of a long-term investment and focusing on the destination provides little insight into the journey one experienced to get there. Adam Smith captured this idea perfectly in Supermoney when he wrote, “Statistics provided rather bloodless answers.” For example, take a look at the chart below, which shows the 7.3% compounded annual growth rate of the S&P 500 for the last twenty years.
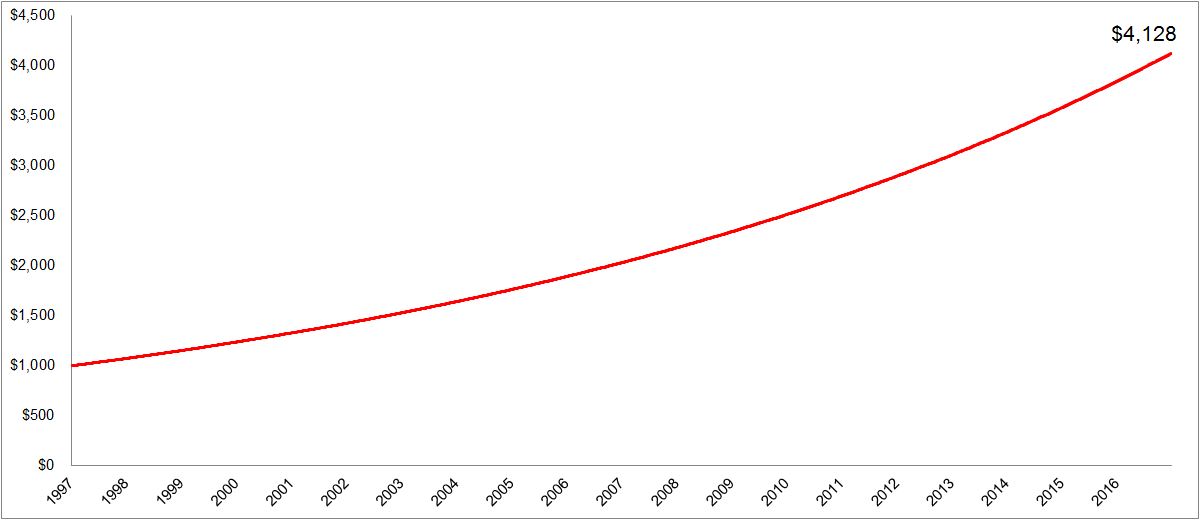
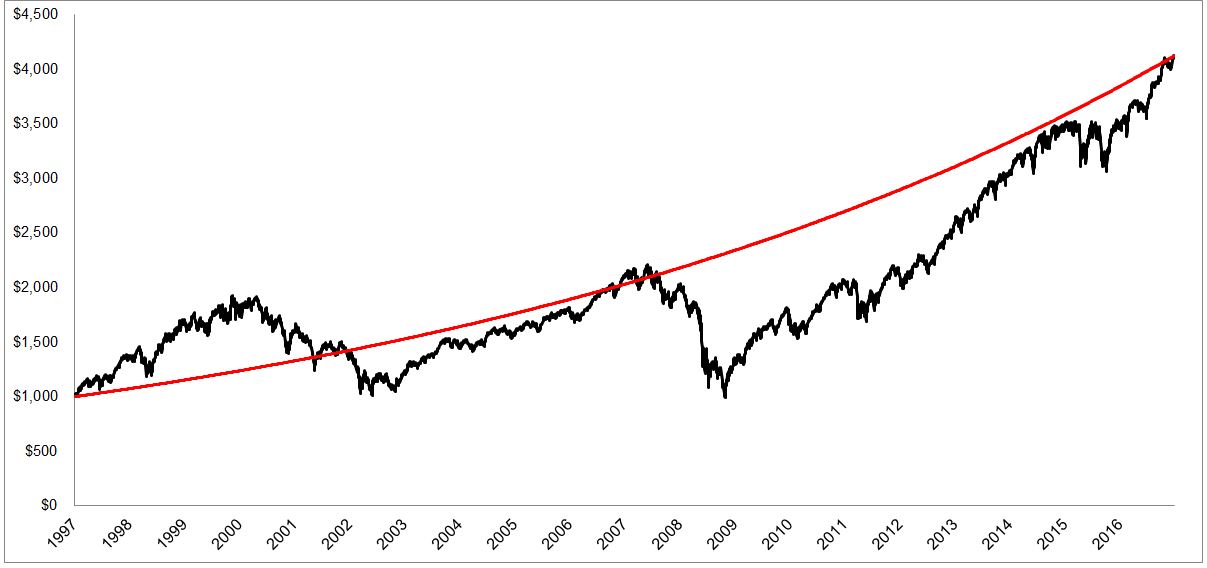
But turning $1,000 in 1997 into $4,128 in 2017 was a brutal experience. That 313% return was paid for with many sleepless nights. The chart below shows the difference between the map and the terrain; all the white space between the red and the black line is where the unforced errors occur.
Below is another chart showing how rough the investing terrain is, plotting the S&P 500 against how far it fell from its highs along the way.
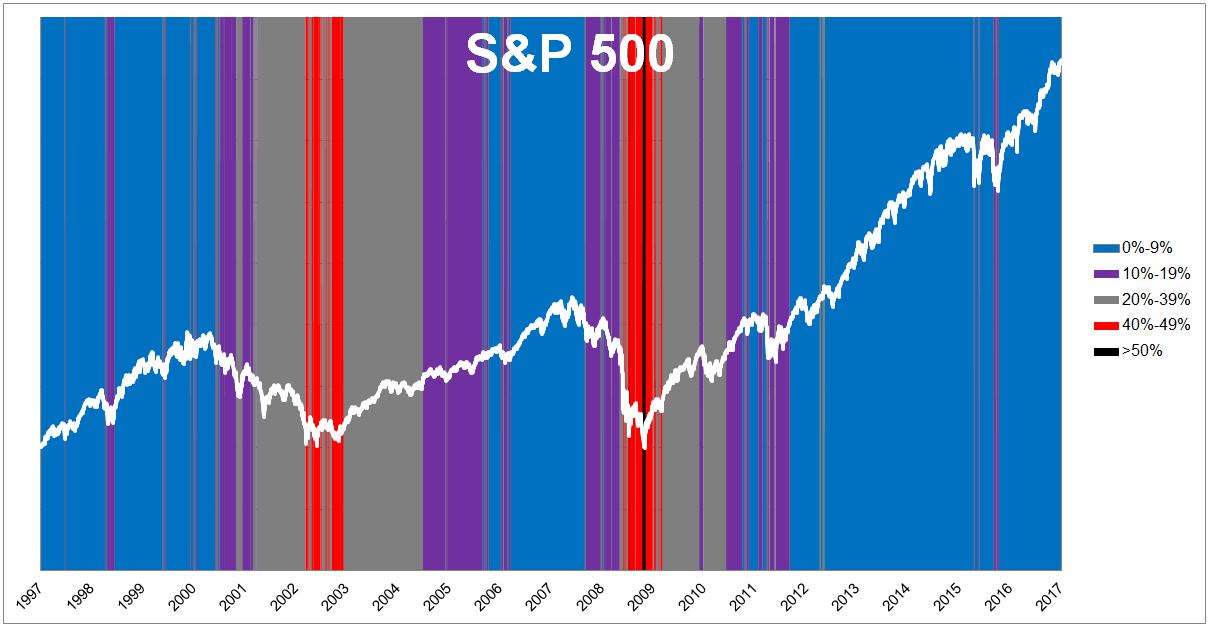
The table below breaks down how much time the S&P 500 has spent in various drawdowns.

A few things jump out at me:
1) 27% of the time the index was 20% or more off its highs.
2) Buying and holding sounds easy, but because of the drawdowns, without a plan it’s almost impossible.
3) The catastrophe scenario, the one that’s always in the back of investor’s minds, occurred just 5% of the time.
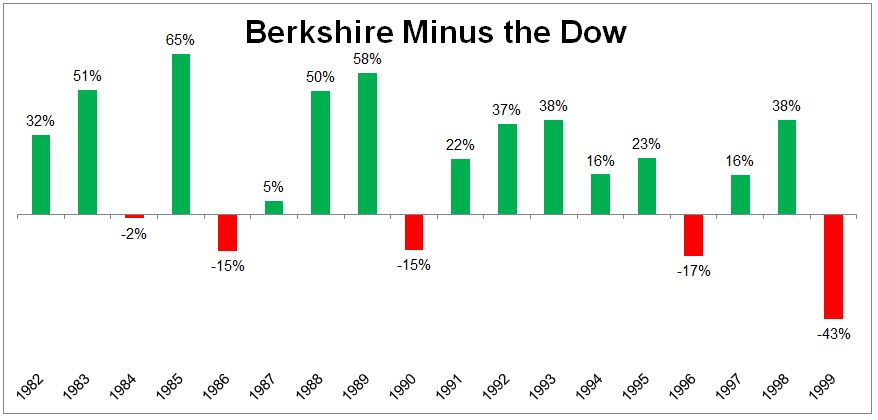
It takes a lot of -self control to earn market returns. It takes skill to beat it, and it requires mental toughness bordering on insanity to crush it. The greatest concentration of these investors can be found in Berkshire Hathaway. In the 1996 annual letter, Buffett wrote:
Gyrations in Berkshire’s earnings don’t bother us in the least: Charlie and I would much rather earn a lumpy 15% over time than a smooth 12%. (After all, our earnings swing wildly on a daily and weekly basis – why should we demand that smoothness accompany each orbit that the earth makes of the sun?) We are most comfortable with that thinking, however, when we have shareholder/partners who can also accept volatility, and that’s why we regularly repeat our cautions.
Berkshire Hathaway gained 9,918% between 1982 and 2000, or 29% a year, but the terrain was rocky as hell. The standard deviation of returns over this 18-year period was 11.5% for the Dow and 33.6% for Berkshire.
The reason why most investors fail to capture market returns is because they overestimate their ability to stay calm when the terrain gets rough. We spend too much worrying about the final destination that we’re often unprepared for the journey.

