Meb Faber recently asked three very interesting questions on Twitter.
- Do you currently own U.S. stocks? 87% Yes, 13% No (1,401 votes)
- Would you continue to hold U.S. stocks if valuations hit a 10-year PE (CAPE) of 50? 55% Yes, 45% No (1,282 votes)
- Would you continue to hold U.S. stocks if valuations hit a 10-year PE (CAPE) of 100? 33% Yes 67% No (2,078 votes)
I voted no for the CAPE 100, and since then I’ve been thinking a lot about this. How far would stocks have to rise to wear such a multiple? I have answers. But first, a little history.
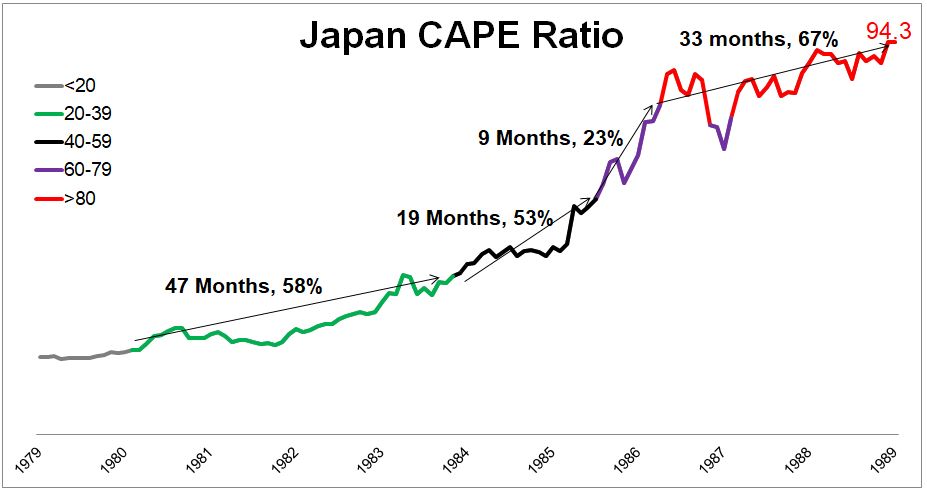
The modern poster child for bubbles is Japan. From 1975-1989, the Nikkei rose 883%, or 16.5% a year. In that 15 year period, it had just one down year in 1977, when it fell 2.5%. It went from a CAPE of 20 in 1981 to a CAPE of 94.3 in 1989.
What if an investor decided to detach from the herd once the CAPE ratio hit 50? At that point, the Nikkei had already delivered 263% over the previous ten years, or 13.8% a year. Not too bad. But once the CAPE ratio broke 50 in 1986, it wouldn’t peak for another 45 months, and it would add another 145%. Could the person who sold at CAPE 50 really sit on their hands for another 4 years as the mania sucked everyone else in?
The chart below shows how much stocks gained at different CAPE levels. So for instance, it took 19 months for the CAPE to go from 4o to 59, and over that time Japanese stocks gained 53%.
Today we find ourselves in a situation with an elevated CAPE ratio, which, if you’re tired of hearing about, I have bad news, this topic probably isn’t going away. More on this later.
How did we get here? I don’t know the why, but the how is that the numerator rose a lot faster than the denominator.
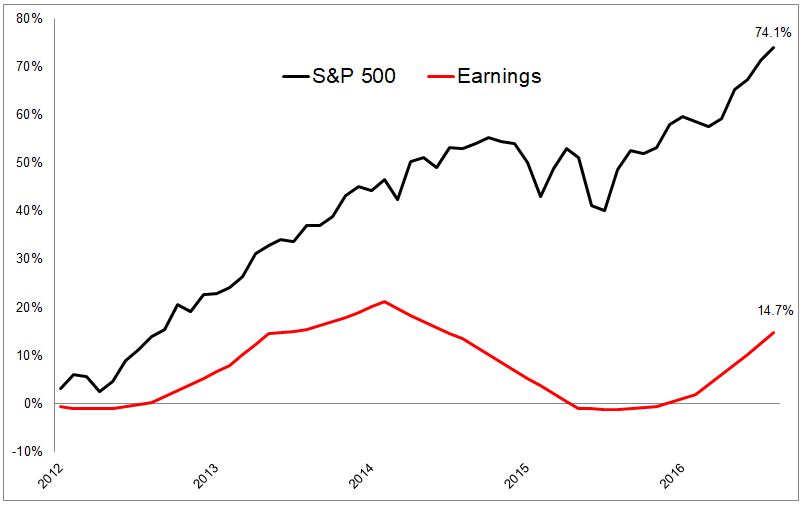
Historically, stocks have grown just slightly faster than earnings, outpacing them by 1.14 times. In the last five years, stocks have grown five times faster than earnings, taking the CAPE ratio from 21 to 30.

If the S&P 500 goes nowhere, and real earnings pick up to 2% a year (real earnings have been 1.25% for the last five years), the CAPE ratio will return to its long-term average in May 2030, 13 years from now.
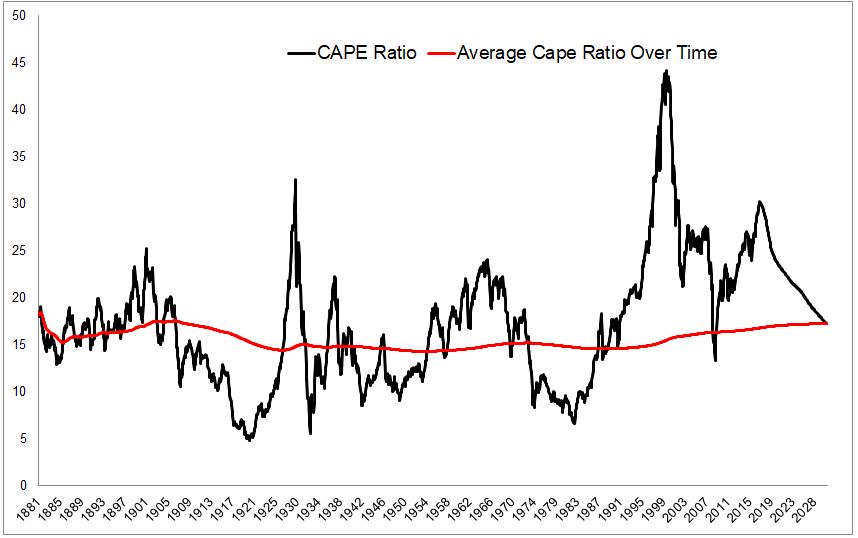
If this sounds depressing, think about this, if stocks earn 0% for the next 13 years, returns have been so strong since 2010, that they still would have earned 4.02% (price only) over the previous 20 years. This is just slightly lower than the average twenty-year period of 4.54%. Even if earnings accelerated to 4% real (table below), it would take a decade of zero returns for stocks to revert to their long-term average CAPE ratio. This is why I said earlier that this CAPE issue is likely here to stay…
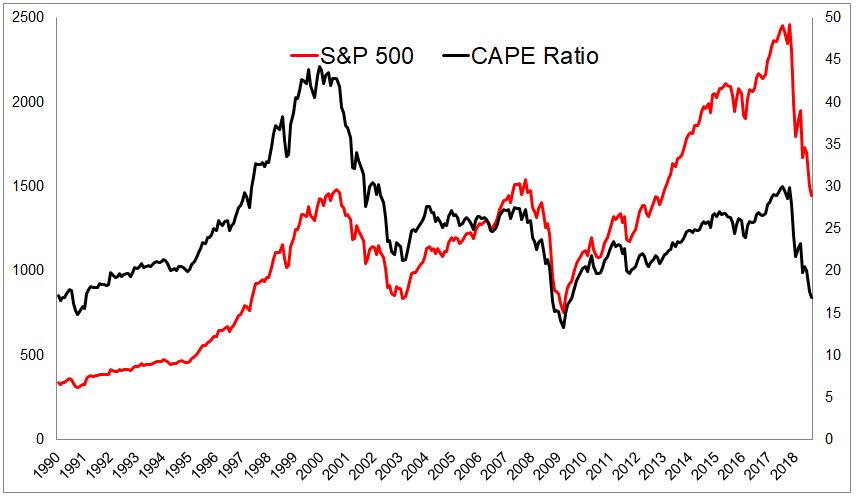
…Unless we have a bear market, of course. If real earnings were flat over the next three years, the S&P 500 would need to fall to 1725, a 30% decline, to fall back in line with its long-term average CAPE ratio. The chart below shows what it would take for the S&P 500 to go back to its long-term average in the next year. If there were no earnings growth over the next 12 months, the S&P 500 would need to fall to 1450, a 41% decline, to fall back in line.
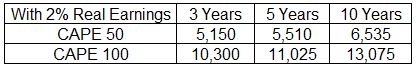
But getting back to Meb’s question, where would stocks need to go in order to achieve a CAPE of 50 and then 100? Again, assuming 2% real earnings growth, below are the levels the S&P 500 would need to get to to support these valuations.
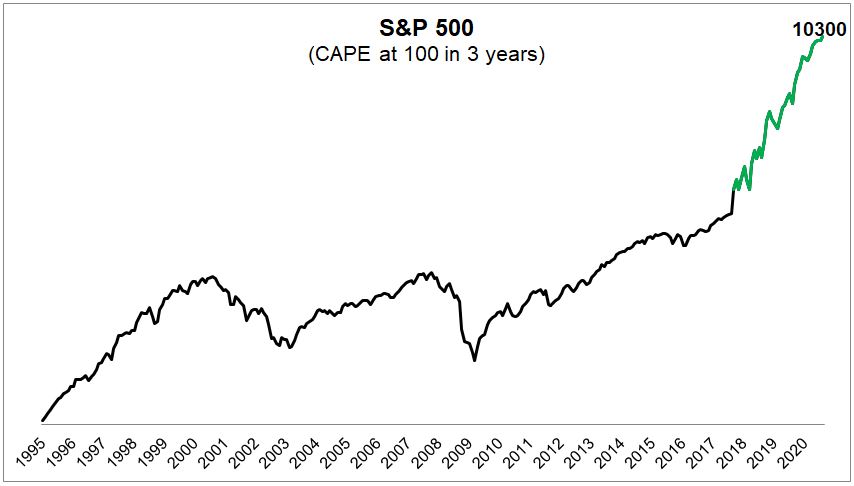
These levels are so far from where we are that they’re hard to conceptualize. The chart below shows the CAPE rising to 100 over the next three years, with stocks rising 316%, or 61% a year.
The table below is similar to the one above, but this shows how much stocks would need to gain to achieve a CAPE of 50 and 100.
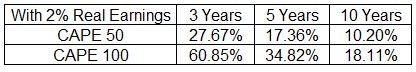
So thinking about Meb’s question, 33% of people said they would hold U.S. stocks at a CAPE of 100, which I thought was absurd. But now I realize that while the theoretical answer should be 0%, the actual answer would be closer to 100%. If stocks hit a CAPE of 100, climbing 61% a year for the next three years, 35% for the next 5 years, or 18% for the next ten years, every single investor on earth- aside from Seth Klarman- would get sucked in. Blue Apron’s debt would go for 150 cents on the dollar.
This will be my last post on the CAPE ratio. Not that I am in the position to put anything to rest, but I feel like at this point I’m beating a dead horse. If the last few years have taught us anything, it’s that prices can stay separated from earnings for longer than seems possible. While earnings and valuations are supremely important to long-term returns, they’re only one slice of an infinite pie of variables.

