Buy and hold isn’t a perfect strategy. If you convinced somebody in the fall of 2007 that this was the right way to invest, they’d have a bone to pick with you, as they’d watch U.S. stocks crash by nearly 60% over the following sixteen months.
But if this person were able to hold on, even if they bought on the day that the market topped, they would have received 7.48% per year over the next 10.5 years. Not so terrible. The most recent decade actually worked out okay for investors, even if it wasn’t easy.
It doesn’t always work out.
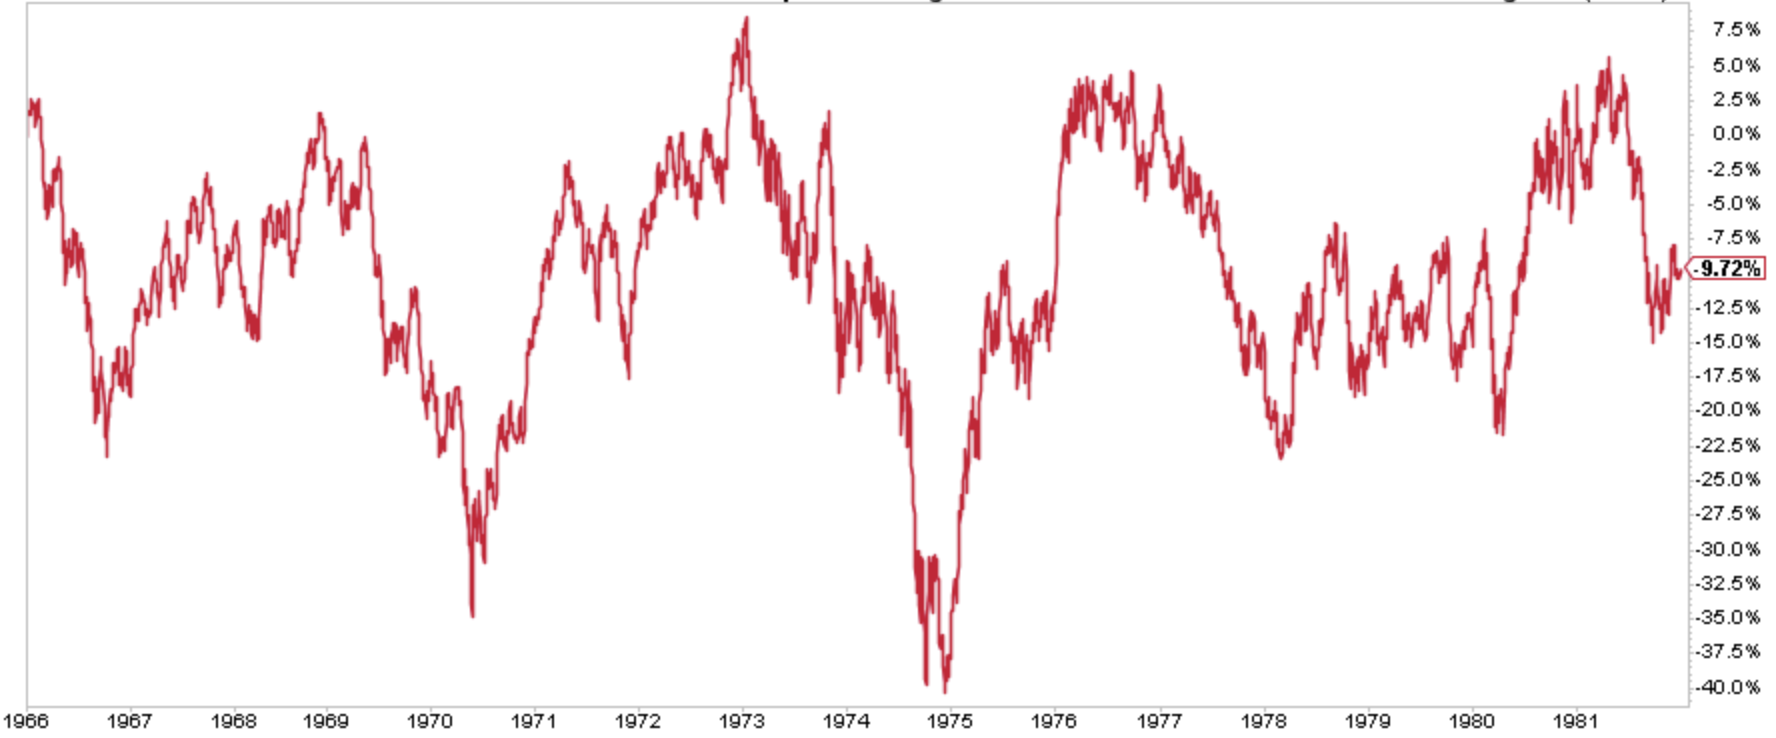
Below is the Dow Jones Industrial Average from 1966-1981. Over this 16 year period, the Dow fell 9% (gained 10% including dividends). Investors who took risk were rewarded with a ton of risk. This can happen. When you buy and you hold, you can expect stock-like volatility. Returns however, are not guaranteed.
So if buy and hold doesn’t appeal to you, the other option you have is to time the market. Which brings me to today.
Last week, the S&P 500 had its worst week in over two years. 4.5% of the week’s 6% decline came during the last two days alone. If you are an active market participant, I assume you took your equity exposure down.
And today, when the S&P 500 gapped up 1.2%, you were probably hoping for the fade, which you got. By 11:15, it had declined 1.4% from its morning highs. And then it rallied 2.18% for the rest of the day, closing near the highs.
If I was still trading, I’d be getting destroyed.
A few things worth mentioning because I know what you’re thinking:
- I was a lousy trader. I don’t deny there are skilled traders.
- I don’t believe that traders or investors got an “all clear” today. I don’t think there is an “all clear” ever. Risk is never not present.
- Just because risk management didn’t pay off today, doesn’t mean it won’t tomorrow.
Back to today.
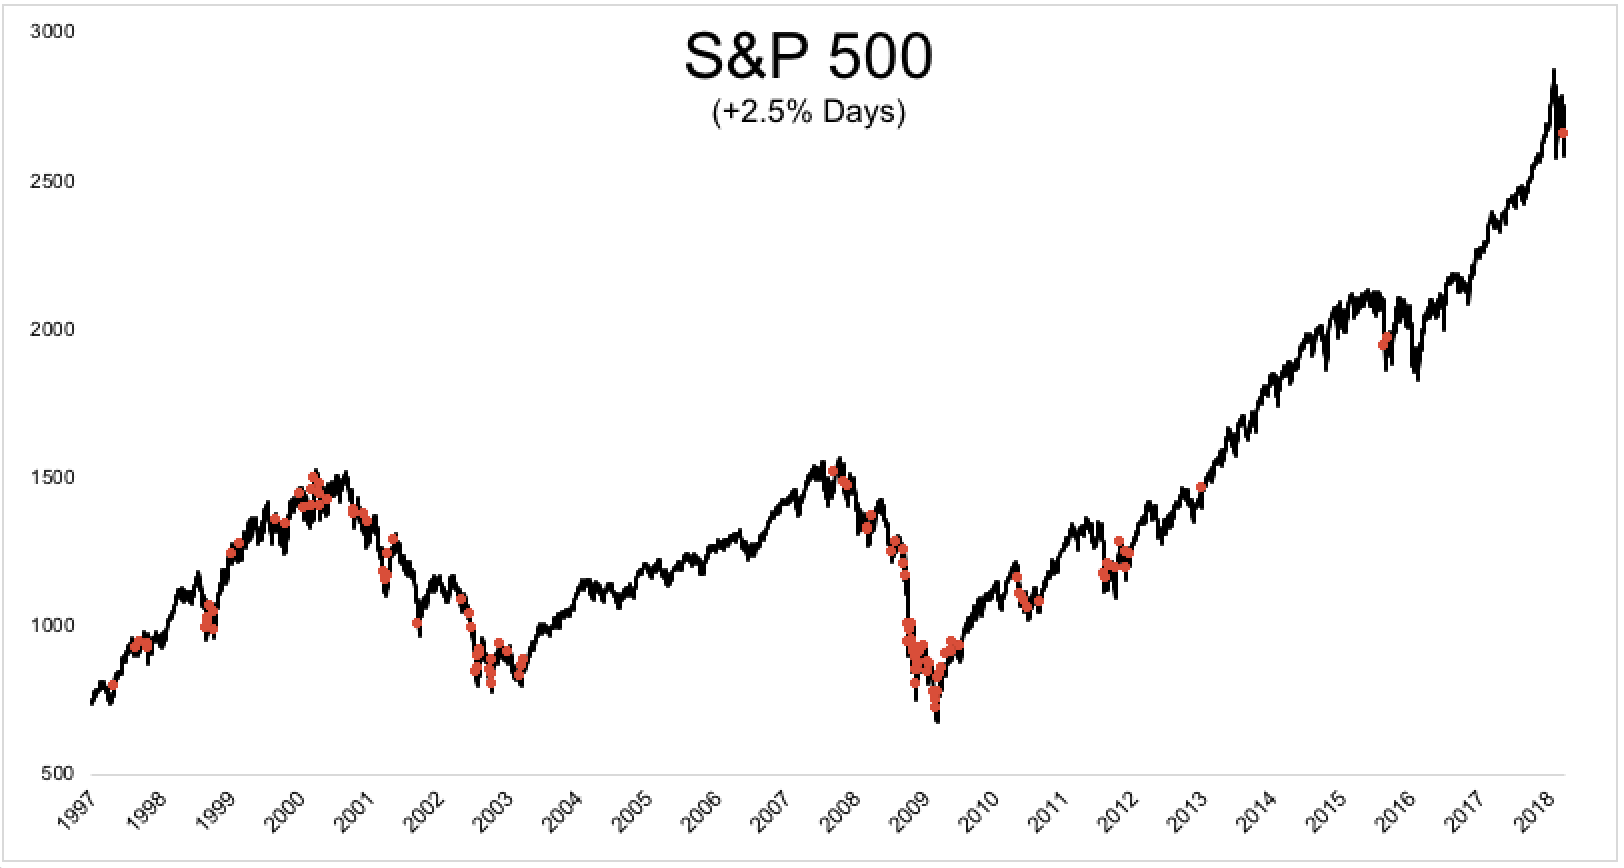
The S&P 500 gained 2.7%, it’s best day since August 2015. It’s nice to see some green after a lot of red last week, but big up days don’t usually occur in healthy markets. Going back to 1970, 74% of the +2.5% days happened under the 200-day moving average. 76% of them happened when the market was already in a 10% drawdown. In other words, the best days tend to be snap backs like we saw today.
Buying panics are pretty rare. You typically don’t see big up days in healthy markets because buyers don’t capitulate all at once the way that sellers do. Of the 169 different +2.5% days since 1970, only five occurred within 1% of an all-time high: November 1980, February 1991, August 1991, February 1999, and March 21 2000 (three days before the top).
What you say in the morning can look foolish in the afternoon and what you say at the close can look foolish at the open. In my opinion, this is not indicative of what I would consider a healthy market environment. To be clear, I’m not predicting we go lower or higher from here. I have no idea, and my strategy isn’t influenced by my short-term market prognostications.
The point I’m trying to make is that sometimes this sucks, and it isn’t easy for any of us. Buying and holding is hard. Trading is hard. An optimal strategy does not exist.


