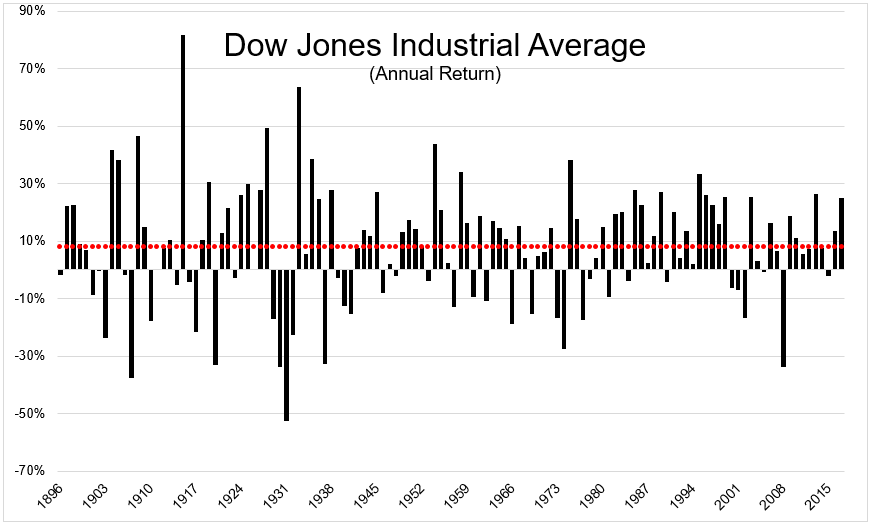
The average market strategist has a 2,943 year-end price target for the S&P 500. This is at the upper range of the typical 8 to 10% return that we expect strategists to expect every year. With an annual standard deviation of 20, an 8% average return means that stocks will return between -8% and +28% 68% of the time if they follow a normal distribution. Spoiler, they don’t.
Averages are often misleading.
John Allen Paulos in Innumeracy writes, “The fact that the average value of some quantity is 100 might mean that all values of this quantity are between 95 and 105, or that half of them around around 50 and half around 150, or that a fourth of them are 0, half of them are near 50, and a fourth are approximately 300, or any number of other distributions which have the same average.”
You can see in the chart below that average twelve month returns are worse than useless when setting expectations. Each bar represents the annual return, with the red dots showing the average annual return.

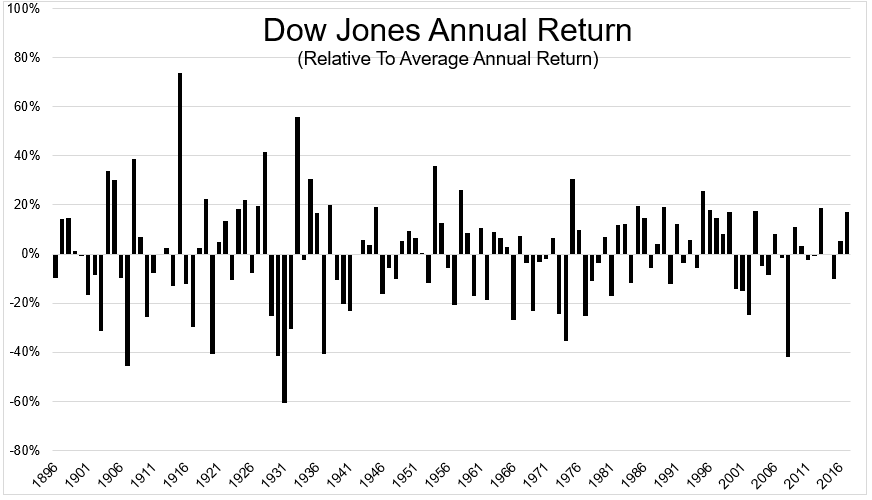
The chart below shows the annual return relative to the average. So you know what you’re looking at, stocks outperformed their average by nearly 20% last year, which is perfectly normal. You’ll notice many more bars jetting up and down than hovering near zero (the average).

The (final) chart really puts into perspective how nonsensical it is to talk about average returns in terms of what we should expect in any given year. Going back to the inception of the Dow (1896, 122 years ago), only 14 years (11% of the time, red bars) were within +/-3% of the average. 33 years were +/- 20% from the average.

Averages are often misleading. Here’s John Allen Paulos again
Flip a coin continuously until a tail appears for the first time. If this doesn’t happen until the twentieth (or later) flip, you win $1 billion. If the first tail occurs before the twentieth flip, you must pay $100. Would you play? There’s one chance in 524,288 that you’ll win the billion dollars and 524,287 chances in 524,288 that you’ll lose $100. Even though you’re almost certain to lose any particular bet, when you win (which the law of large numbers predicts will happen about once every 524,288 times on the average), your winnings will more than make up for all your losses. Specifically, your expected or average winnings when playing this game are (1/524,288) x (+ one billion) + (524,287/524,288) x ( – one hundred), or about $1,800 per bet. Still, most people will choose not to play this game despite its average payoff of almost $2,000.
On average, the coin toss will pay $1,800 per bet. In reality, each bet will lose $100.
You should expect forecasts of between 8 and 10% per year every year, but history shows that stocks have been close to the average just 11% of the time. The great Peter Bernstein nailed it when he said, “The greater the variance of the standard deviation around the average, the less the average return will signify about what the outcome is likely to be.”

