When Amazon filed for its IPO in 1997, it was valued at almost $300 million ($470 million in today’s dollars). Today, there are 95 private companies in the United States valued at more than $1 billion. Private companies are eschewing public markets for longer, and growing larger than they have ever before.
In a related but tangential matter, the number of publicly traded companies in the United States has been cut in half over the last twenty years. These two facts, and they are facts, have led to to a few arguments which are far too simplistic and warrant closer examination:
1- There aren’t enough public companies (too few IPOs)
2- Dollars are accruing to the venture capitalists who represent wealthy investors, and therefore…
3- Mom and pop investors are being robbed of returns
These ideas aren’t all wrong, I just think that like most complex things, they’re not black or white. Let’s take them in order.
There aren’t enough public companies (too few IPOs)
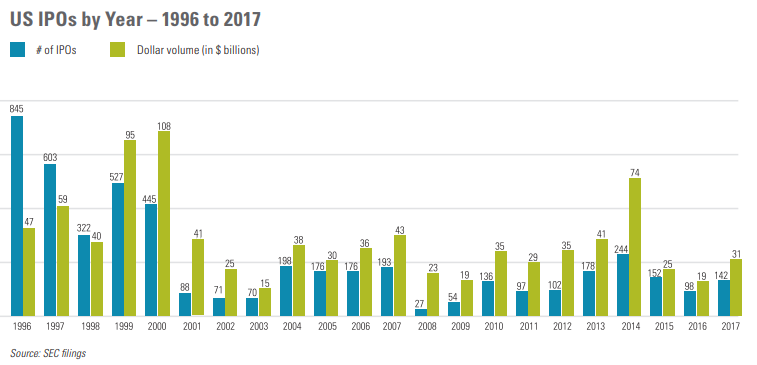
From 2013-2017, there were 814 IPOs. In 1996 alone there were 845. The IPO market today is normal- it’s the late 90 boom that’s making comparisons to today look like something is amiss.
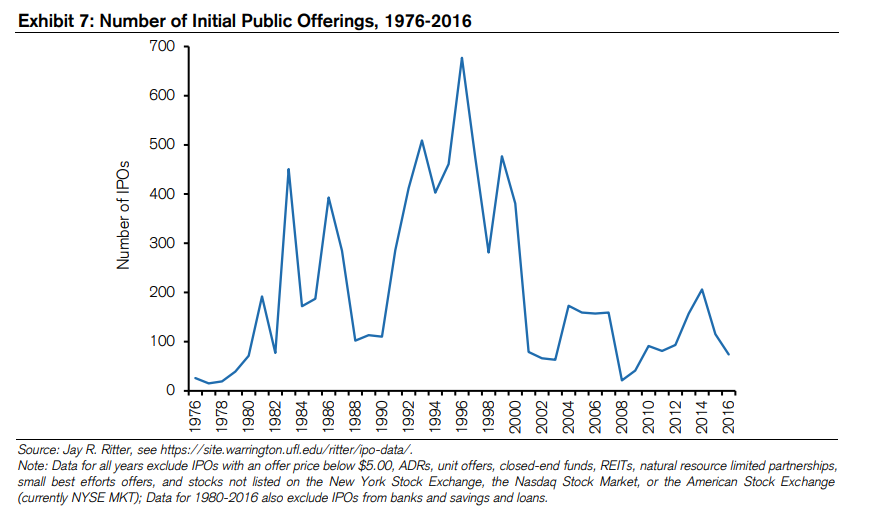
As you can see in the chart below from the 2018 IPO Report by WilmerHale, both the number and dollar volume of IPOs have been fairly steady over the last decade.
 What has absolutely changed is that companies are raising more money in the private market than ever before. In 1998, the median amount raise prior to an IPO was $13 million. Today that number is close to $100 million.
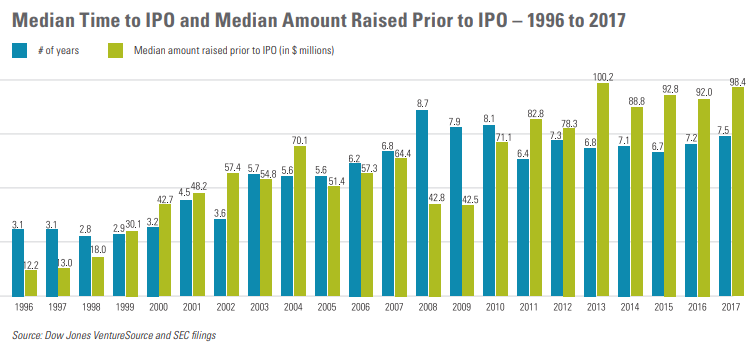
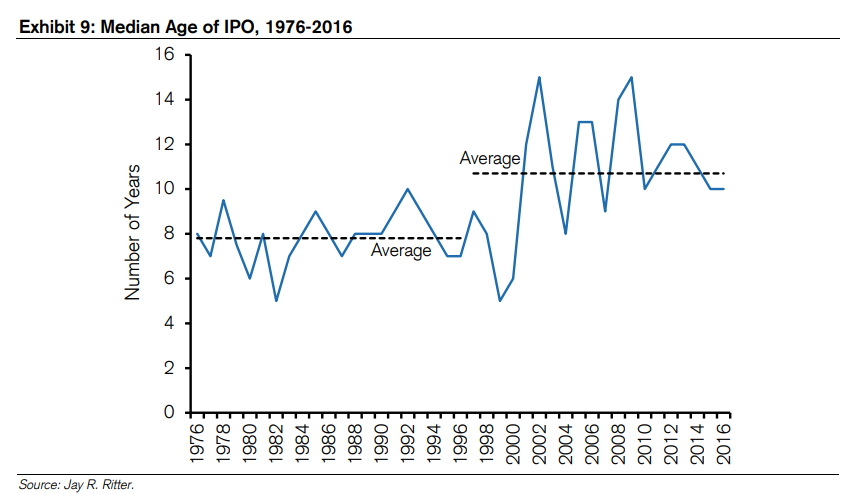
Credit Suisse shows that the median age of companies doing an IPO was 7.8 years from 1976 to 1996 and 10.7 years from 1997-2016
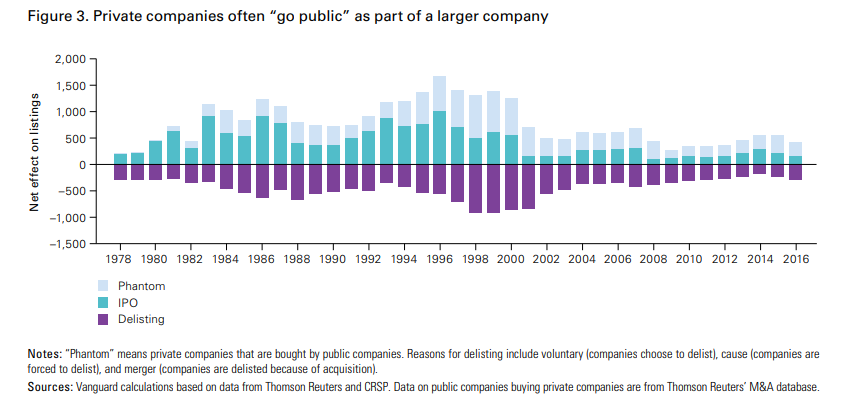
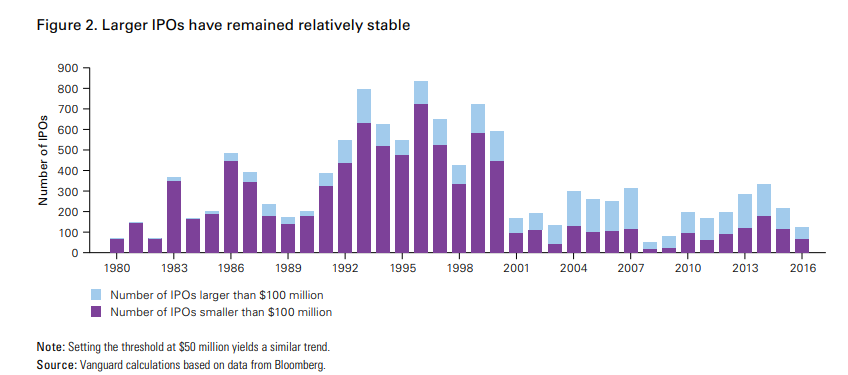
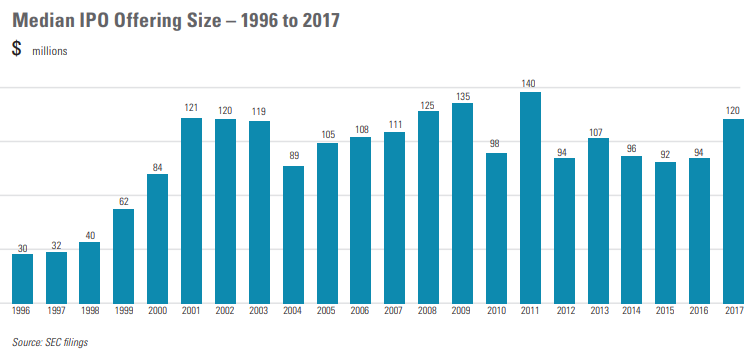
While we are seeing much larger IPOs than in the past, the argument that investors are missing out on the early growth of giant companies are coming from people that are falling prey to the availability bias. The vast majority of IPOs are not gigantic like Facebook or Alibaba. In fact, the median IPO size has been remarkably steady over the last two decades. (More IPO charts at the end of the post)
Are there too few public companies? I don’t think so- there are thousands public stocks that trade on major exchanges, and another 10,000 that trade on the OTC market.
And if this isn’t enough, the number of listed companies rose 50% from from 1996 through 2016 in 13 developed countries around the world.
The fact that companies are staying private longer has nothing to do with why there are half the public companies than there were twenty years ago, which I’ll get into in a later post.
Dollars are accruing to the venture capitalists who represent wealthy investors
In a McKinsey report, Grow Fast or Die Slow, they created this tremendous visual which shows a handful of software companies in particular are now reaching a $10 billion valuation prior to going public.
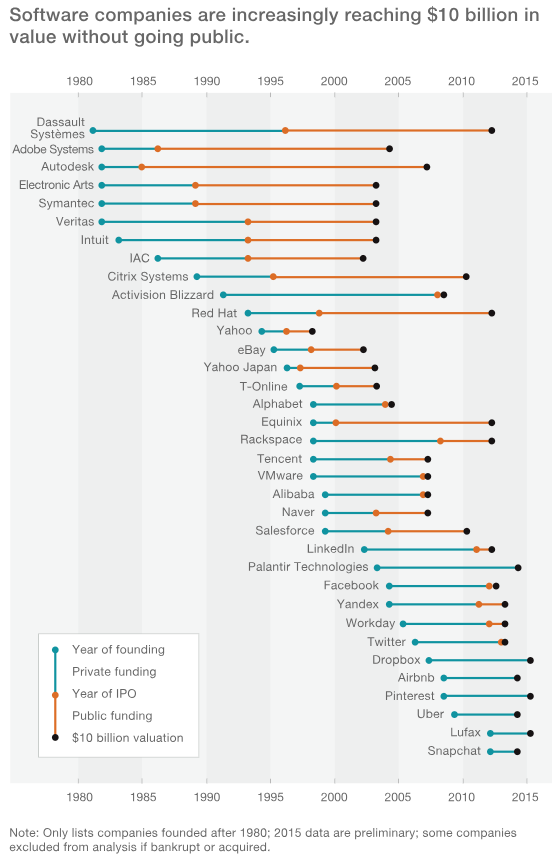
The successful companies are reaching a $10 billion valuation quicker than ever before, but charts like these prey on our susceptibility to get fooled by survivorship bias. Charts like the one above don’t include the losers.
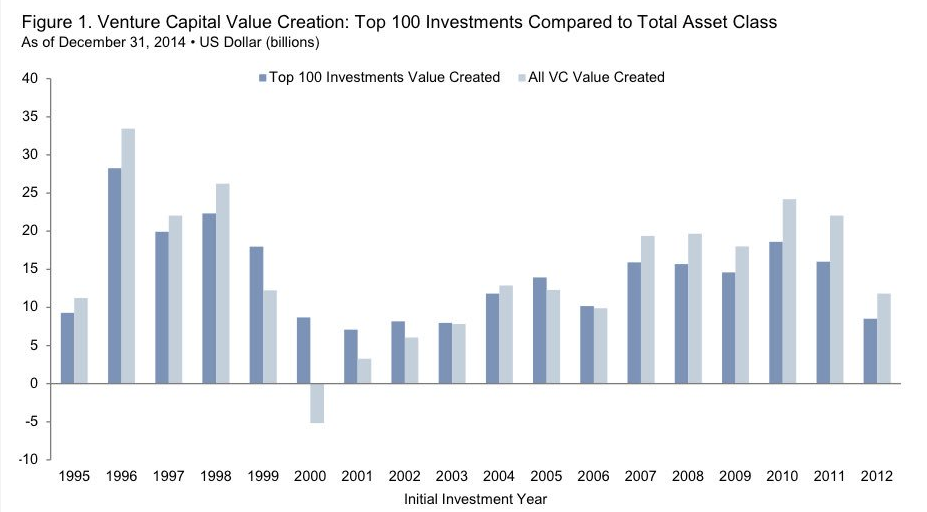
Some people have described venture capital as lottery tickets for rich people. The evidence backs this up. Out of 21,640 financings between 2004-2013, 65% of them received a multiple of 0-1x, with less than 10% of all deals experiencing a 5x multiple or higher.

A burgeoning private market is not necessarily a bad thing. Betting on startups is something that probably should be limited to people that can afford to gamble. Theranos raised $700 million in capital in the private markets and is now worth zero dollars.
Mom and pop investors are being robbed of returns
The Wall Street Journal reports, “The Securities and Exchange Commission wants to make it easier for individuals to invest in private companies, including some of the world’s hottest startups.”
I don’t think this is a great idea for a multitude of reasons. First, let’s take a look at how some of the world’s hottest startups have performed in public markets.
To get a better sense of how IPOs have performed recently, I looked back at some of the high-profile names that have come public since 2012. (Data from Ycharts. These numbers were run a few weeks ago). Keep in mind that these returns are since each IPO, so their start dates vary from as early as 2012 (Facebook, Splunk) all the way through 2018 (Spotify, Dropbox).
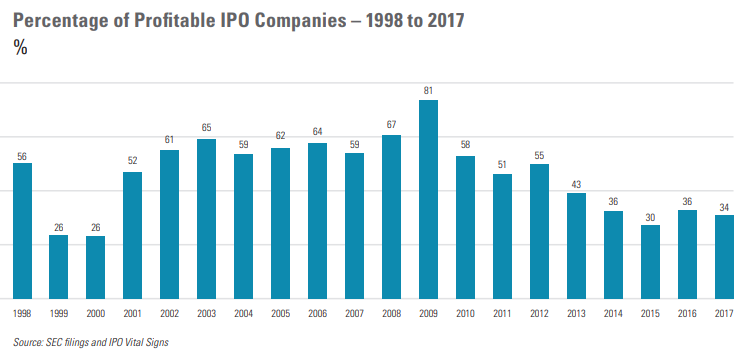
It’s been a mixed bag, with some big winners and some big losers. By the end of 2017, 30% of the companies that went public that year were trading below their offering price (WilmerHale).

It’s impossible to know if these companies would have been treated differently if they came public earlier, but I highly doubt that the average investor could separate the winners from the losers regardless of whether they came public in its 2nd or 7th year.
Below is the same chart, only this time showing the change in market cap since the IPO. These valuations are muddied by the fact that Twitter priced its IPO for a $14 billion valuation at $26 per share, but the first trade was at $45.10 and closed at $44.90. So to determine the change in market cap, I used closing share price on the first day of trading.

Pareto is alive and well. These 35 companies combined have gained $786 billion in market cap since going public, but Facebook and Alibaba are responsible for 85% of that (Sorry).

Public and private investors have different goals, different skill sets, and different experiences. Getting the public involved with the private might sound like a decent idea during a brainstorming session, but closer examination might not hold up to scrutiny.
Maybe even more so than public markets, private markets are dominated by a few winners, and the few winners are usually in the hands of the best investors (h/t ROIChristie).
The companies that show the best potential can be selective about who they choose to work with, and I doubt mom and pop would be their first choice. Usually they go for the Benchmarks and Sequoias of the world.
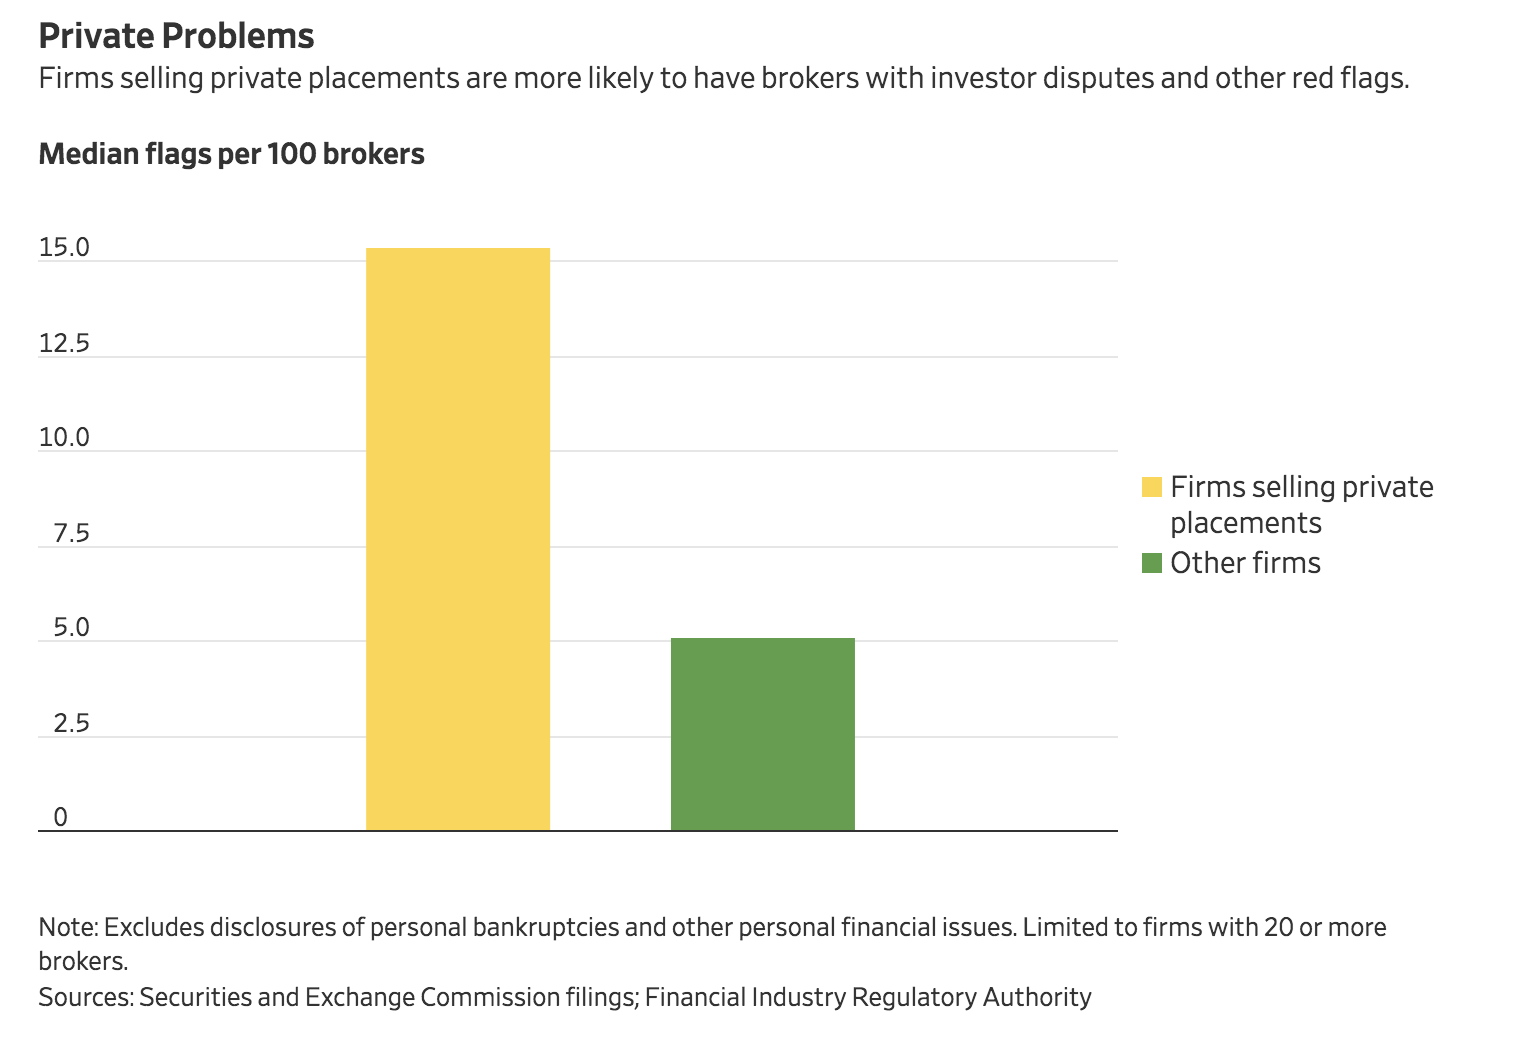
As far as getting mom and pop getting access to private companies, it’s already happening. Pension funds, which represents teachers and fire fighters are investing in private companies. These investments won’t make or break these people’s retirements, but elsewhere private investments are having a real impact on mom and pop investors. The Wall Street Journal recently reported that “More than 1,200 firms sold around $710 billion of private placements last year.”
The problem with public money with private companies is that there needs to be an intermediary, and this is where you’re likely to find the worst actors. It’s easy to overpromise what returns can look like in a private company. The exclusiveness of these “deals” makes these products the go-to tools for alpha predators of the financial industry. The graphic below shows the median flag per 100 brokers for firms that do and don’t see private placements.
 The little guys are not being robbed of anything. The S&P 500 is up 178% over the last few years. And if people are hell bent on accessing smaller companies, they can do so via IWC, the iShares micro cap ETF (I know it’s not perfect), which has a weighted average market cap of $615 million, is up 162% over the last five years.
Private companies are a risky business and the venture capital and private equity funds are better equipped to do the due diligence, and frankly, absorb the losses than John and Jane Doe.
Yes, early investors in Facebook made millions of percent, but public investors have made billions of dollars. And for every Facebook, remember there was a GoPro and a Groupon.
Sources:
What’s behind the falling number of public companies?
The Incredible Shrinking Universe of Stocks
SEC Chairman Wants to Let More Main Street Investors In on Private Deals