On Monday, for the first time since October 2014, the Dow Jones Industrial Average closed beneath its 200-day moving average. Many people wonder what the implications for this might be. Do stocks bounce right here and if so, how long can we expect them to hold? The truth is that speculating on where they go from here is a shot in the dark so rather than guessing, I want to share some facts about what the 200-day moving average has historically meant for stocks.
When bad things have happened, they tended to do so below the 200-day. Since 1960, 22 of the 25 worst days have occurred below the 200-day moving average. Of the 100 worst single days over the last 55 years, 83 of them happened while stocks were below the 200-day.
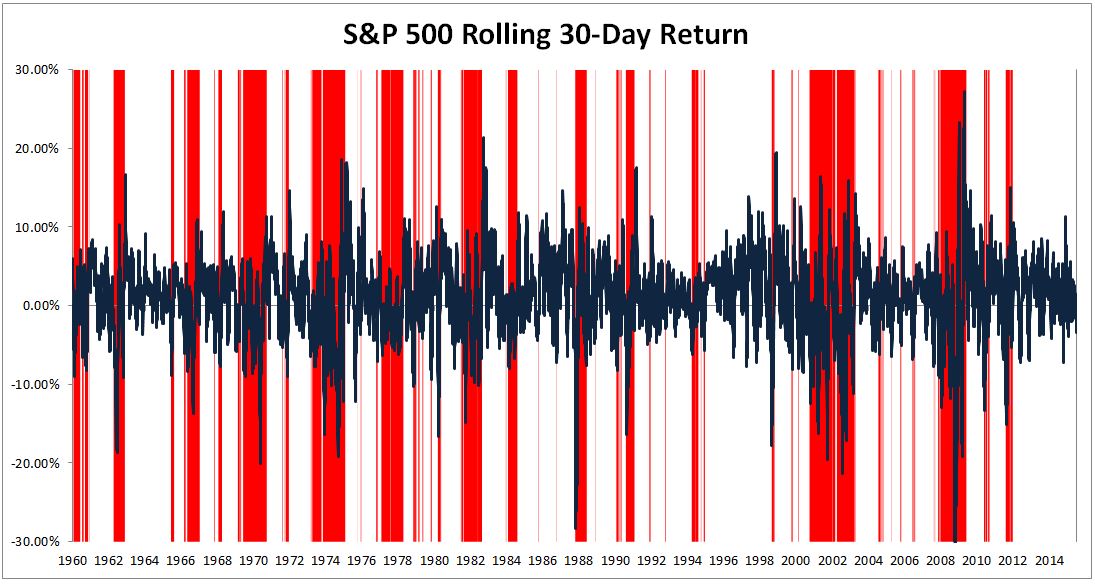
The chart below shows the rolling thirty-day return for the S&P 500. Areas highlighted in red are when stocks are below the 200-day. What you’ll notice is that this is where the vast majority of negative spikes occurred. The average 30-day return going back to 1960 is 0.88%. The average 30-day return when stocks are below the 200-day is -2.60%.
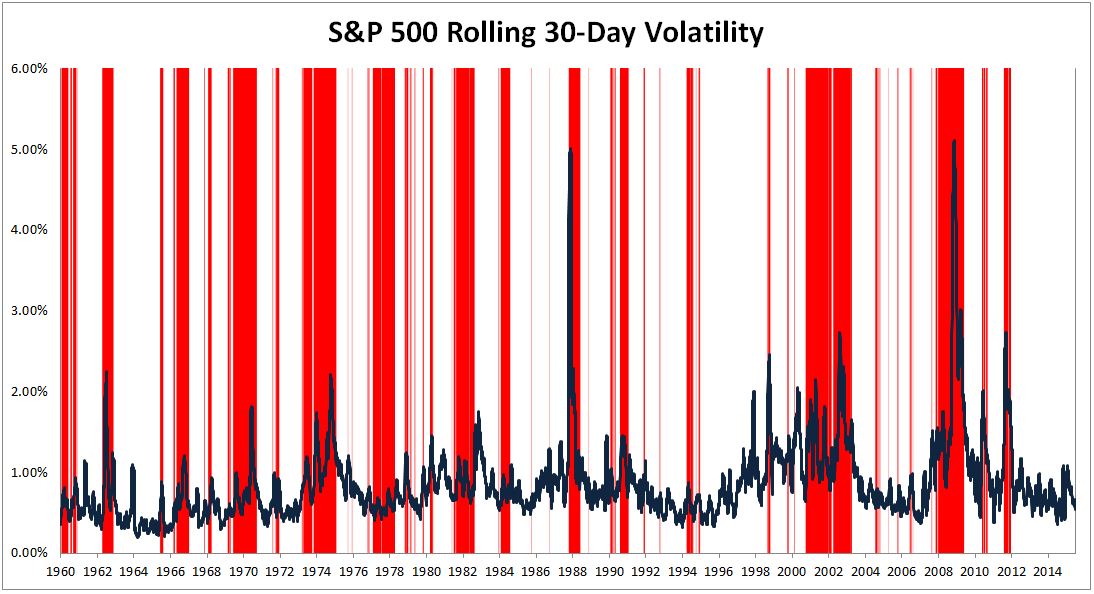
Similarly, most of the volatility spikes happened when stocks were below the 200-day. The average rolling thirty-day standard deviation for the S&P 500 is 0.87%. The average rolling thirty-day standard deviation for the S&P 500 below the two-hundred day is 1.16%. That’s 13.8% annualized for all periods and 18.4% for periods below the 200-day.
The important thing to keep in mind is not whether stocks stay exactly above a line on a chart. People who pretend this is the purpose of technical analysis are either uninformed or have an agenda. Of all the indicators out there, many of which I think do more harm than good- the 200-day moving average is one that has had implications in the past. Being that this is just the simple dynamics of supply and demand, I expect it can have similar implications going forward.
Michael Batnick is a managing partner at Ritholtz Wealth Management. He is the co-host of Animal Spirits, What Are Your Thoughts, and The Compound and Friends. For disclosure information please see here.
Get a Full Investor Curriculum: Join The Book List
Every month you'll receive 3-4 book suggestions--chosen by hand from more than 1,000 books. You'll also receive an extensive curriculum (books, articles, papers, videos) in PDF form right away.