Show people the following chart and one hundred percent will choose to invest in the blue line.
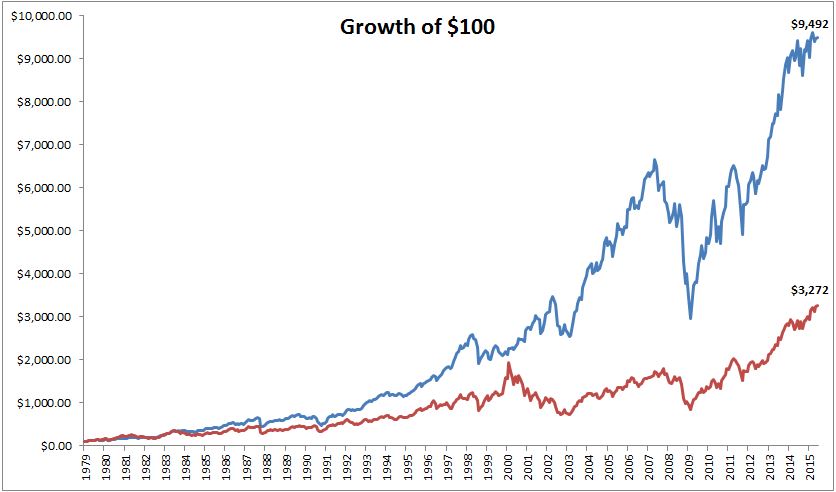
The blue line represents the Russell 2000 Value Index and the red line is the Russell 2000 Growth Index. The problem with long term charts like these, especially for the laymen, is that this greatly oversimplifies things. The naked eye wouldn’t pick up on the period from August 1998 to February 2000, when the Growth Index returned 83%, while the “no-brainer” value stocks lost 1%. How many people could maintain discipline in this type of situation? Speaking with older advisors, many of them found interacting with clients in the late 90′s to be even more challenging than the great recession.
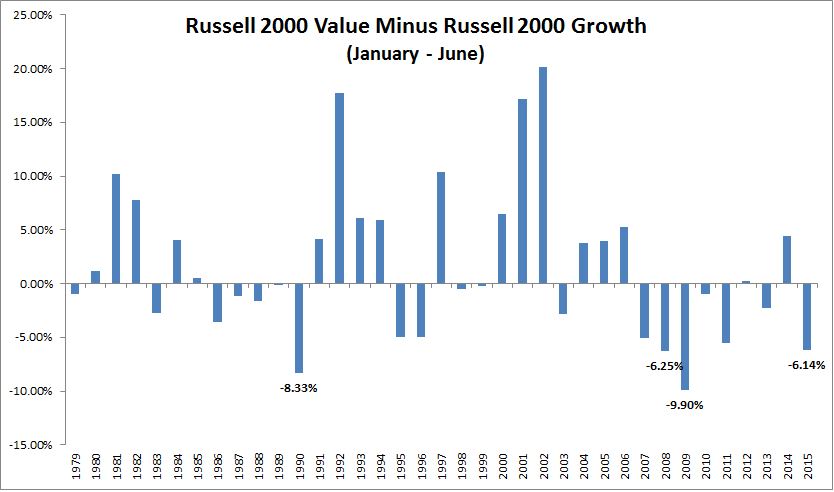
We’re currently in one of those similar periods of under performance, although not nearly to the same degree as during the tech bubble. The first half of the year has been the fourth weakest period for small value relative to small growth (since the inception of the index).
I think that past investor performance is probably a decent indicator of one’s future performance. If you’re able to look at a parts of your portfolio with pure disgust and not act on this emotion, you’re on track to being successful long-term investor.

