A 0.5% Day

Today we saw what is typical of an unhealthy stock market. This morning, when it looked as if stocks might have a monster day, I tweeted that 22 of the 25 single best days since 1970 occurred under the 200-day moving average. The point is that outlier days, both to the upside and to the downside, tend to happen in sick markets.

Today, the S&P 500 got as high as +2.9% from the previous close and fell as much as -4.15% from those highs. This is just the 59th time this has happened in the last 11,518 days, or 0.5% of the time. What you’ll notice in the table below is that this type of day has happened in pretty ugly markets.

UGLY

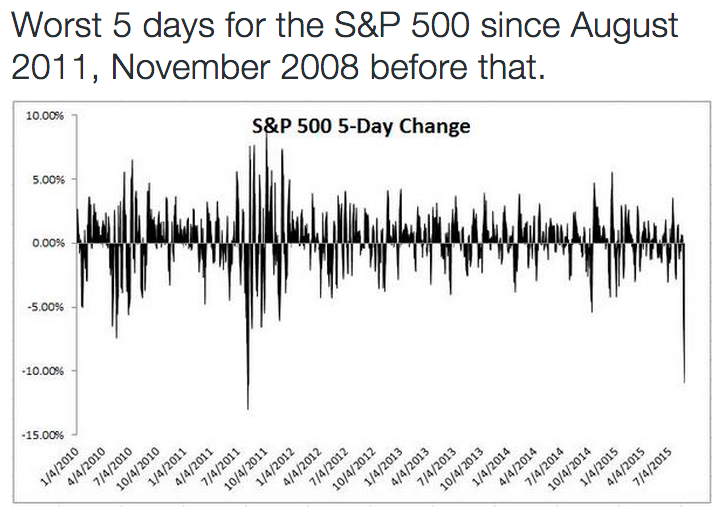
Stocks have just been punched in the mouth, falling more than ten percent in just the last five days.

Screen Shot 2015-08-25 at 7.05.40 PM

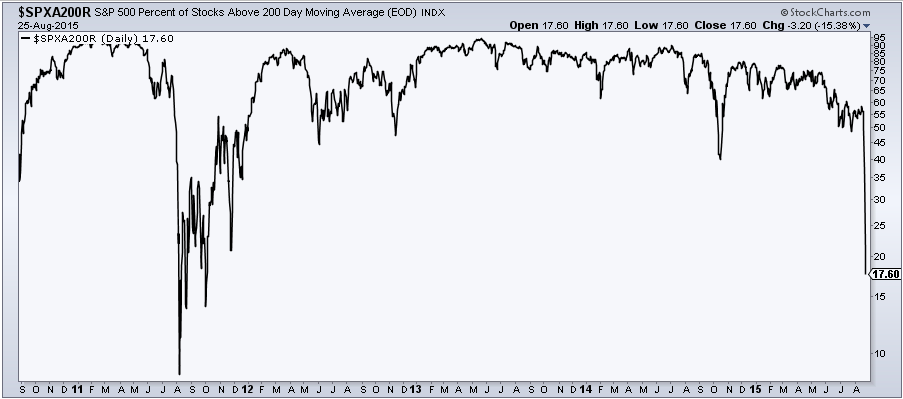
More stocks are below their 200-day moving average than at any time since 2011.

Screen Shot 2015-08-25 at 7.04.30 PM

The good news about resetting expectations and letting some air out of stocks is that it sets us up for higher future expected returns. The other reason to not jump out of the window is that there are no obvious recessionary signs, not yet anyway. Volatility happens fast, which is why having a plan in place to reduce the number of decisions you make under duress is key.

This content, which contains security-related opinions and/or information, is provided for informational purposes only and should not be relied upon in any manner as professional advice, or an endorsement of any practices, products or services. There can be no guarantees or assurances that the views expressed here will be applicable for any particular facts or circumstances, and should not be relied upon in any manner. You should consult your own advisers as to legal, business, tax, and other related matters concerning any investment.

The commentary in this “post” (including any related blog, podcasts, videos, and social media) reflects the personal opinions, viewpoints, and analyses of the Ritholtz Wealth Management employees providing such comments, and should not be regarded the views of Ritholtz Wealth Management LLC. or its respective affiliates or as a description of advisory services provided by Ritholtz Wealth Management or performance returns of any Ritholtz Wealth Management Investments client.

References to any securities or digital assets, or performance data, are for illustrative purposes only and do not constitute an investment recommendation or offer to provide investment advisory services. Charts and graphs provided within are for informational purposes solely and should not be relied upon when making any investment decision. Past performance is not indicative of future results. The content speaks only as of the date indicated. Any projections, estimates, forecasts, targets, prospects, and/or opinions expressed in these materials are subject to change without notice and may differ or be contrary to opinions expressed by others.

The Compound Media, Inc., an affiliate of Ritholtz Wealth Management, receives payment from various entities for advertisements in affiliated podcasts, blogs and emails. Inclusion of such advertisements does not constitute or imply endorsement, sponsorship or recommendation thereof, or any affiliation therewith, by the Content Creator or by Ritholtz Wealth Management or any of its employees. Investments in securities involve the risk of loss. For additional advertisement disclaimers see here: https://www.ritholtzwealth.com/advertising-disclaimers

Please see disclosures here.