Over the last five and ten years, less than twenty percent of large-cap managers beat their benchmark. Should we be surprised to see that eighty percent of these funds fail to deliver returns above the S&P 500? Let’s turn to the data.
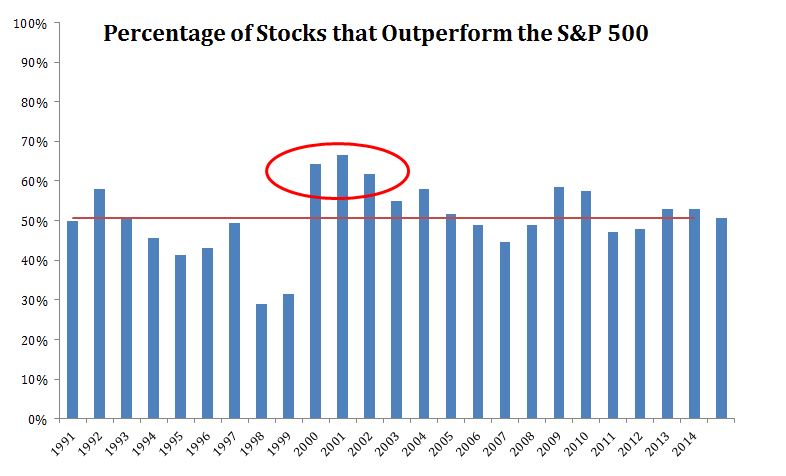
On average, 50.6% of stocks beat the market in any given year. This makes intuitive sense, half the stocks beat the index and half do worse. Over the last twenty-four years, the percentage of stocks beating the index got as high as 66.5% in 2001 and as low as 29% in 1998. This data begins in 1991 which is as far back as S&P member performance goes on Bloomberg.
I suspect that the aftermath of the tech bubble helped fuel the recent explosion of hedge funds because this was the best time in the last quarter century for stock pickers. In 2000, 2001 and 2002, 64, 66 and 62 percent of S&P 500 stocks beat the index. In no other year since 1991 has 60% of stocks beat the index.
Tilting away from expensive tech stocks was very lucrative as the euphoria surrounding dotcom stocks unwound.
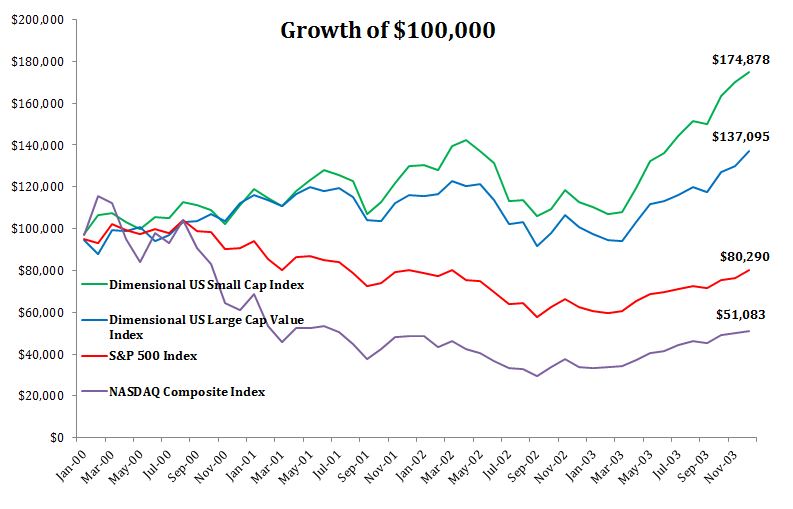
Look at the total returns from 2000 through the end of 2003 for the indexes in the table above:
Dimensional U.S. Small Cap: 74.9%
Dimensional U.S. Large Cap Value: 37.1%
S&P 500: -19.7%
NASDAQ Composite: -48.9%
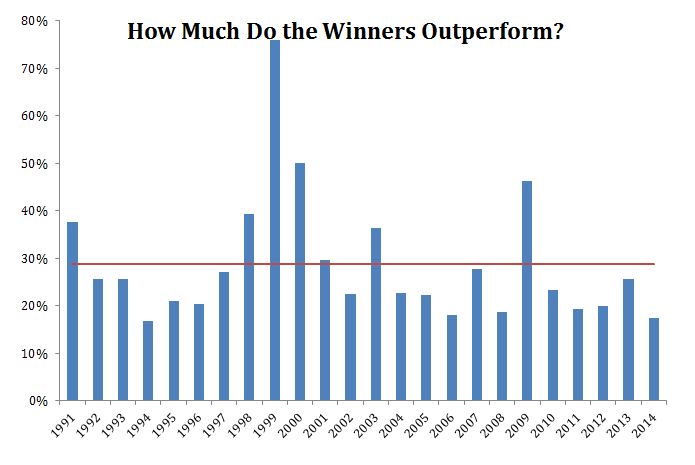
In 2000 as the market peaked, the average winning stock outperformed the index by 50%. This is one of the allures of stock picking. Over the last twenty-four years, the average winning stock outperformed the index by 29 percent. The average losing stock underperformed by just 21 percent. If only picking winners and avoiding the losers was so easy.
In 1999, the average winning stock outperformed by 76%. However, only thirty-one percent of stocks outperformed that year, the second lowest reading of the data set. Even if you remove Qualcomm, which returned 2600%, the average outperformance of the winners was still 60%. In other words, only a few stocks outperformed, but the outperformance was massive.
A few other interesting things worth mentioning.
As the tech bubble gained momentum, it was obvious that fewer and fewer stocks were participating in the rally. I don’t know that calling the top was obvious, and I wasn’t in the markets then, but the data i’m referencing was available, and no doubt was pointed out by some at the time. The S&P 500 (TR) was up 28.58% in 1998, but the average stock was up 15% and the median stock was up just 7%. In 1999, the S&P 500 returned 21% while ~28% of stocks fell 20% that year. Furthermore, the median stock was flat even though the index experienced a 21% rise.
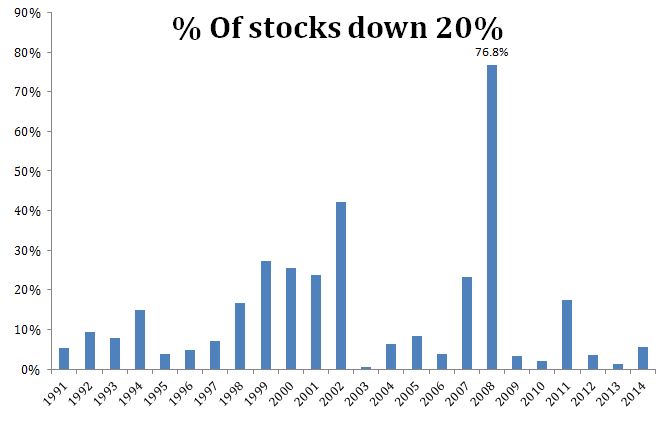
2008 was a bad year for the indexes and a worse year for individual stocks. Just 5% of stocks were positive that year.
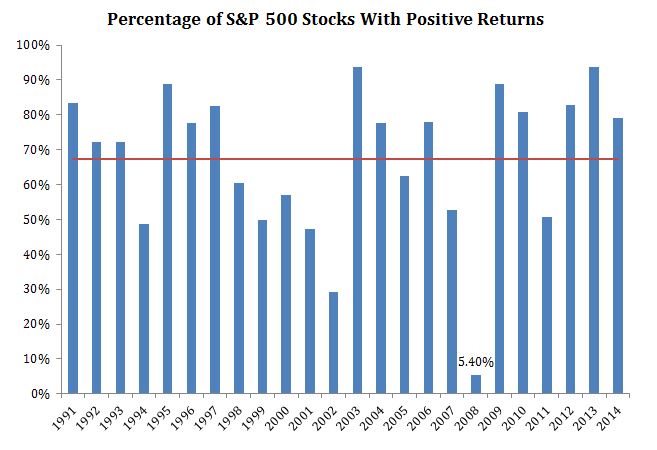
Not only were so few stocks up, but it’s also true that so many got annihilated. 77% of stocks lost at least twenty percent. Thirty-two percent of stocks lost at least 50% and one out of ten stocks lost at least 70%.
It often helps to look inside the market. Stocks and indexes do not spend much time at the average. The average annual S&P 500 total return since 1991 is 11.85%. However, only two years saw returns between eight and twelve percent. The point is that some years stock selection is a futile effort, while other times it can be a endeavor worth pursuing. The tricky thing of course is that we’ll never know in real time whether we’re investing in the stock market or the market of stocks.


what was your source for this data?
Bloomberg for the individual components.
[…] the Market of Stocks (Irrelevant Investor) • Bernanke Pins Weak Recovery on Congress (NYT) see also Bernanke: GOP Congressman are why […]
[…] Inside the market of stocks (Irrelevant Investor) […]