This is the small cap secret no one ever told you;
You’ve probably heard about the small stock premium, the idea that over long periods of time, small stocks outperform large stocks. There are a bunch of different theories as to why this is the case. Some believe the additional returns are compensation for decreased liquidity, additional volatility, or both. Whatever the reason, small stocks have done demonstrably better than large stocks over the last ninety years.
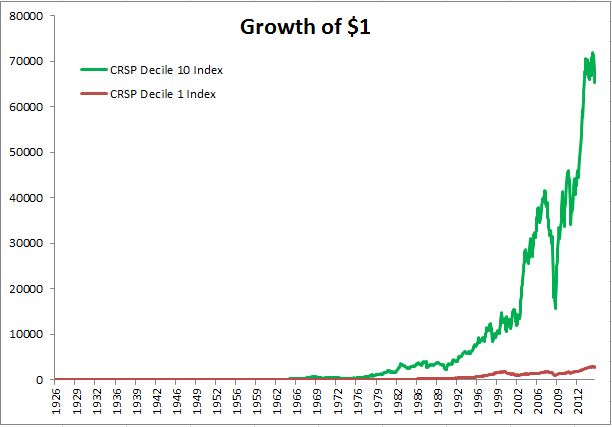
If we dig a little bit, we’ll notice some peculiarities in the data. Maybe the 6,263,652% outperformance from decile 10 deserves some further scrutiny.
Over the last 44 years since 1972, the single best month for the smallest U.S. stocks, as represented by CRSP Decile 10, was 40%. In the ten years from July 1932 through January 1943, there were ten months better than 40%. What is the reason for this? Did small cap stocks do so much better than large stocks in the decade between the Great Depression and World War II than they have in recent times?

I recently read an eye-opening paper by Edward Mcquarrie- The Myth of 1926: How Much Do We Know About Long-Term Returns on U.S. Stocks? Mcquarrie takes a closer examination on the methodology CRSP used to calculate returns from the smallest decile of stocks. If you’re a small cap aficionado, please read on to the end, there is plenty of light at the end of the tunnel. Emphasis is mine.
Prior to 1962, only NYSE listed stocks were included in the CRSP index. Here is Mcquarrie on the history of CRSP.
“Beginning in December 1972, CRSP records include data on NASDAQ stocks. NASDAQ earlier that year brought stocks that had been traded ‘over the counter’ onto an exchange. At a stroke, the number of stocks tracked on CRSP more than doubled, from over 2,000 to over 5,000. Virtually all of these stocks were in existence, and traded, before they appeared in CRSP.” Put another way, CRSP data immediately prior to December 1972 excluded more U.S. stocks than were included. On the other hand, CRSP ‘total market capitalization,’ with NASDAQ, AMEX and NYSE stocks included, increased to about $816 billion, only some 20% greater than it would have been using NYSE stocks only. With 80% plus coverage in terms of capitalization prior to the inclusion of NASDAQ, true ‘total market’ returns based on NYSE stocks alone are not likely to be too far off in the years immediately preceding the addition of NASDAQ stocks to CRSP.”
So returns from large caps are not likely to be altered too much with the inclusion of NASDAQ listed stocks. Small caps on the other hand…
“The picture is dramatically different if we focus on how effectively CRSP sampled the universe of small stocks prior to the inclusion of NASDAQ stocks in December 1972. In the tradition of Fama French, the smallest stocks are defined with respect to the bottom capitalization decile on the NYSE. As of December 1972, the bottom decile was defined as the 139 NYSE stocks having capitalizations of $28.74 million or less…It appears that CRSP added 1,961 small NASDAQ stocks to the bottom decile in December 1972, to accompany the 666 small AMEX stocks already included. In other words, if in 1972 one attempted to measure the return on the smallest stocks using only the 139 small NYSE stocks, one would exclude about 95% of the small stocks then in existence, and about 91% of small stock capitalization.”
Mcquarrie on NYSE listed stocks.
“Prior to July 1962, small NYSE stocks were the only small stocks included in the CRSP. Addition of AMEX stocks in that month expanded CRSP coverage of the bottom decile from 113 to 656 stocks. But the New York Times listings for the last trading day of July 1962 show hundreds of additional stocks trading over the counter and on regional exchanges, many presumably small. It seems fair to conclude that immediately prior to July 1962, CRSP (and the NYSE) sampled at most 10% of the smallest U.S. stocks then trading.”
This is where it starts to get interesting…
“It is important to recognize that by the advent of CRSP data in 1926, only the largest and best capitalized stocks could achieve listing on the New York Stock Exchange. Smaller and less-seasoned firms had to be content with a listing on a regional stock exchange or outdoors on ‘the Curb.’….It follows that the ‘small’ stocks included in CRSP data prior to 1962 generally, and in the 1920s and 1930s in particular, were limited to once-large stocks that had fallen on hard times; genuinely tiny firms could not appear in CRSP. There is little reason to believe that returns on the limited number of small stocks that do appear in CRSP during that era, can be generalized to the returns to be expected from the much larger population of genuinely small stocks incapable than as now of meeting NYSE standards for listing.”
Here’s where it gets more interesting…
“Accepting that small stocks in the CRSP dataset in the 1930s were actually deeply depressed large stocks helps to explain what are otherwise anomalous results. According to Ibbotson data, the 1926-1945 period was a terrific time to invest in the bottom decile of CRSP stocks, with a compounded return of 17.6% as compared to a return of 5.9% on the largest stocks in decile 1. However, it strains credulity that these 20 years of boom, crash, depression, and war were among the best possible times to invest in the weakest and most vulnerable of businesses.”
Here’s where it gets completely nuts….
“Closer examination shows that much of this return came in the months of August 1932 and May 1933, in which decile-10 CRSP stocks returned 120.4% and 106.6% respectively- approximately 12 and 10 standard deviations above the mean monthly return for this decile, respectively. If we accept that the small stocks in CRSP at that time were actually deep value stocks- larger firms whose prices had fallen perhaps more than any others- then the extreme price increases for small stocks seen at the depths of the depression in the 1930s make perfect sense. It is only logical that prices of otherwise substantial businesses that had been beaten down the most should snap back the hardest when the market’s recovery began.”
Cover your eyes…
“By the end of July 1932- the month the Dow Jones Industrials bottomed out- 80% of all NYSE stocks in the bottom decile had bid prices less than or equal to $1 per share, while the bid-ask spread for these prices averaged 135% of the bid price (e.g., bid ½, ask 1-1/8). It would be folly to mistake bid-ask bounce in deep value penny stocks, measured from the bottom of perhaps the greatest stock crash in U.S. history, for evidence of the long-term out-performance of all small stocks versus all large stocks across other, calmer periods. But that is the risk we run when we fail to recognize CRSP’s sampling bias against the inclusion of truly small stocks prior to 1962.”
Alright, that was a lot.
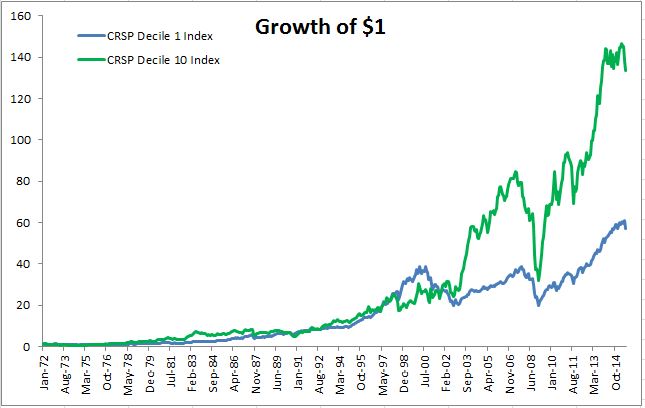
I was pretty stunned when I read this. I imagine you’re feeling something similar. Here is the good news. Small stocks have done quite well since 1972, when CRSP included both Amex and NASDAQ listed stocks. From 1972-today, CRSP Decile 10 has compounded at 11.86%, versus 9.71% for Decile 1.
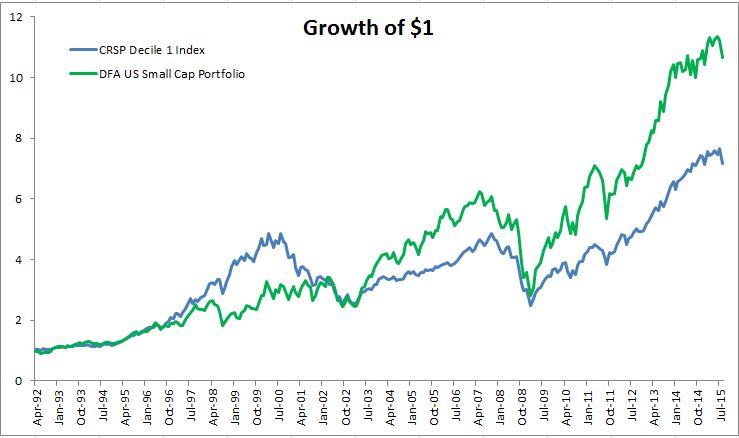
Here is the better news, the DFA US Small Cap portfolio, which is a live track record, has compounded at 10.63% since inception (April 1992) versus the 8.77% compounded return for CRSP Decile 1.
The point of sharing this is not to disparage small cap stocks. I do believe they offer investors a premium and this has been demonstrated over the last forty plus years. Dimensional Funds has enjoyed a tremendous amount of success investing in small cap stocks not just in the United States, but around the globe as well. The point is that when presented with data, sometimes it makes sense to dig a little bit deeper.
Source:
The Myth of 1926: How Much Do We Know About Long-Term Returns on U.S. Stocks?
Disclaimer: The performance data shown represent past performance, which is not a guarantee of future results. Investment returns and principal value will fluctuate, so that investors’ shares, when sold, may be worth more or less than their original cost.


[…] also a larger problem methodology. Michael Batnick relates the poor statistical foundation that the long-term returns are based […]