There has been a lot of talk lately about the lack of participation; how only a few stocks are actually rewarding shareholders while so many have been burning them. Winners have been few and far between but it’s not as if the index is exactly on fire. While it’s true that without Amazon and Google the market would be down, even with them, the S&P 500 is only up 1.5% for the year.
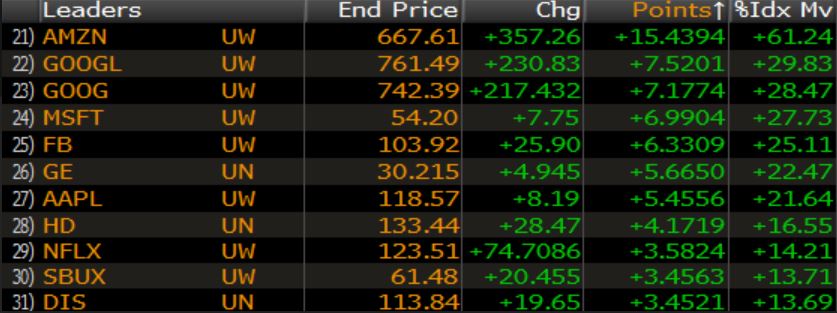
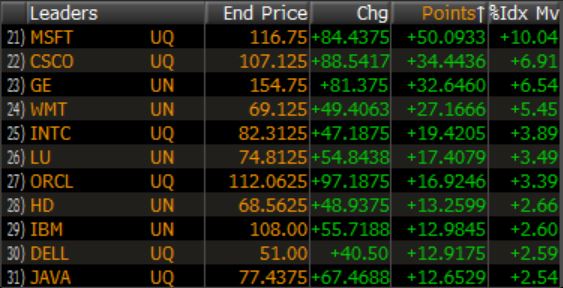
To get a sense of what real narrow leadership looks like, let’s look at the most extreme example, the late 90’s. From 1998-1999, the S&P 500 gained over 50% while the top five stocks alone accounted for one-third of the gains. What we’re experiencing now isn’t narrow leadership, it’s just not a great market.
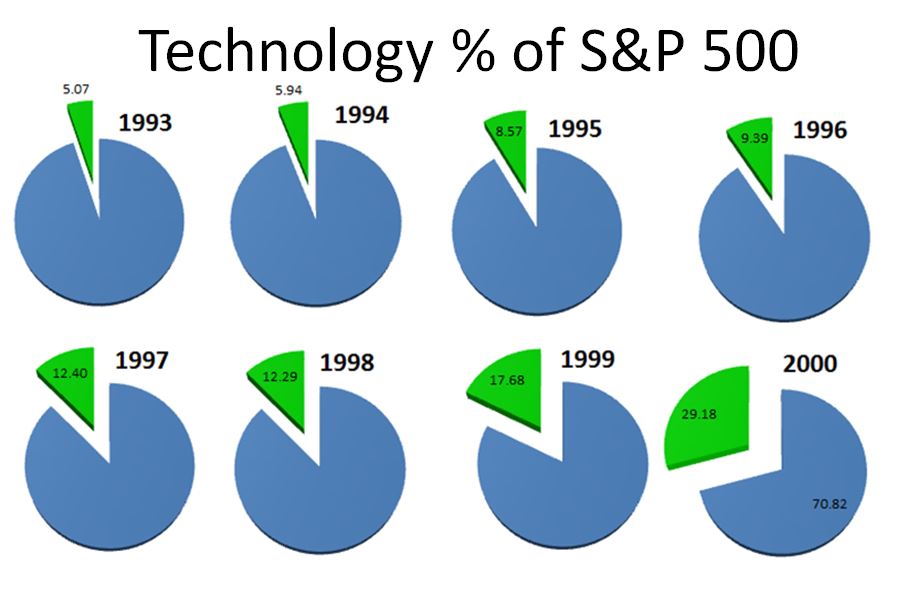
Going back to 1991, the average change in S&P sector weights from year to year is just 0.34%. From January 1998 to January 1999 and January 1999 to January 2000, the technology sector exploded, with its weight in the S&P 500 increasing 44% and 65% respectively.
In 1999 the average stock was up 20.9% while the median stock was up just 0.09%. So far in 2015, the average stock stock is up 1.5% while the median stock is 0.8%. In other words, the big gains are skewing the average, but nowhere near to the degree that they did in 1999, when leadership was paper thin. Today, 47% of the index is negative for the year, with the average return of those stocks being -16.8%. In 1999, 49.4% of the index was negative, with the average return being -23%.
We know how that story ended. The largest, most over-owned stocks came tumbling down the hardest, taking the cap-weighted index with them. The S&P 500 would go on to underperform the S&P equal-weight index for the next five consecutive years as all the excess wore off. From 2000 through 2004, the S&P 500 equal-weight index returned 36% while the S&P 500 would lose 18% (hello smart-beta).
The tricky thing about making actual investment decisions based on leadership, or lack thereof, is figuring out when the index will stop going up is extremely difficult. In 1999, it was clear to anyone watching that just a few stocks were holding the markets up. In fact, the NYSE A/D line topped back in April 1998. The problem is that the index didn’t top for another 500 days and ran 36% over that time.
I have no idea whether or not whether selling will reach the Google and Amazon or what that might do to the overall markets, but it would be pretty hilarious if the market went higher and left them behind. People were referring to the N.B.A market a few years back (nothing but Apple). Then from September 2012 through April 2013, Apple fell by 45%, while the S&P 500 advanced nearly 7% over the same time.
Maybe we’ll look back in a few years and say “FANG” was the tell. Unfortunately, we cannot look froward with certainty, but only backwards. The rear-view mirror is always 20/20.

