As we await for the inevitable(?) first rate hike since 2006, let’s take a moment to review what type of year it’s been for U.S. Stocks.
The S&P 500 has done a whole lot of nothing this year and currently is up just 0.04%. Looking at this minuscule number helps clarify what we already know, that so much of the day-to-day stuff on the screen and on TV is just noise.
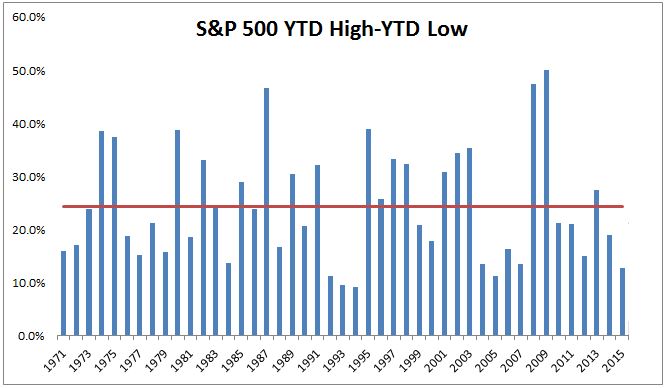
Would you believe that the S&P 500 has been up no more than 3.5% this year and down no more than 9.3%. To be fair, I’m anchoring to the beginning of the year. One can easily make the case that the 12.5% drawdown from May to August is more relevant than the arbitrary YTD return. Anyway, for the purposes of this exercise, I am using YTD numbers. What I want to point out is that the S&P 500 has been in an unusually tight range. The spread between the YTD high and the YTD low of 12.8% is around half of the average range we’ve seen for the last 45 years.
The chart below is another visual.
What’s interesting about a flat market is people seem to think it means something for returns going forward; that volatility is going to pick up or that returns next year are going to be above or below average. This just is not the case. Looking at rolling 12-month periods going back to 1926, the average return following a period of flat markets (+/- 3%) is 7.4% compared to the 7.6% we see for all twelve-month periods.
As we wind up 2015, we look back on the decimation of oil and other commodities, the high-yield blow up, Greek fears, peak profit margins and the end of QE, we look around and see a stock market that is precisely unchanged. Sure many stocks were destroyed and this doesn’t accurately represent the story of 2015 for many investors, but for most investors, as John Bogle likes to say, “the stock market is a giant distraction to the business of investing.”
Michael Batnick is a managing partner at Ritholtz Wealth Management. He is the co-host of Animal Spirits, What Are Your Thoughts, and The Compound and Friends. For disclosure information please see here.
Get a Full Investor Curriculum: Join The Book List
Every month you'll receive 3-4 book suggestions--chosen by hand from more than 1,000 books. You'll also receive an extensive curriculum (books, articles, papers, videos) in PDF form right away.