Bad Markets and 52-Week Lows

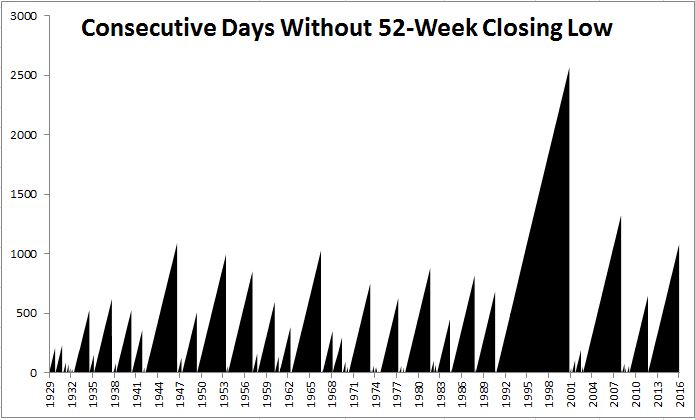
The S&P 500 just closed at a 52-week low (January 20) for the first time since October 2011. The 1079 days between 52-week closing lows is the fourth longest streak of all time.

I went back and looked at what happened in years that experienced a closing low versus those that didn’t and the results were pretty interesting.

A few observations:

  • Of the 37 years that experienced a 52-week closing low, the average return was -10%. Of the 49 years that did not experience a 52-week closing low, the average return was 18%.
  • 35% of all years have had negative returns. At 70%, years that saw a 52-week closing low were twice as likely to finish in the red.
  • 2% of all days have closed at 52-week lows.
  • 1974 had 38 different 52-week closing lows, the most of any year. 2008 had 27, for comparison.
  • Just because we recently had a 52-week closing low, does not mean you should run and dump all your stocks. On five different occasions did a year see a 52-week closing low and still finish up double digits.

I’m sure I’ll get a lot of “no shit Sherlock” for this, but to keep it simple, the takeaway is that bad things tend to happen in bad markets.


This content, which contains security-related opinions and/or information, is provided for informational purposes only and should not be relied upon in any manner as professional advice, or an endorsement of any practices, products or services. There can be no guarantees or assurances that the views expressed here will be applicable for any particular facts or circumstances, and should not be relied upon in any manner. You should consult your own advisers as to legal, business, tax, and other related matters concerning any investment.

The commentary in this “post” (including any related blog, podcasts, videos, and social media) reflects the personal opinions, viewpoints, and analyses of the Ritholtz Wealth Management employees providing such comments, and should not be regarded the views of Ritholtz Wealth Management LLC. or its respective affiliates or as a description of advisory services provided by Ritholtz Wealth Management or performance returns of any Ritholtz Wealth Management Investments client.

References to any securities or digital assets, or performance data, are for illustrative purposes only and do not constitute an investment recommendation or offer to provide investment advisory services. Charts and graphs provided within are for informational purposes solely and should not be relied upon when making any investment decision. Past performance is not indicative of future results. The content speaks only as of the date indicated. Any projections, estimates, forecasts, targets, prospects, and/or opinions expressed in these materials are subject to change without notice and may differ or be contrary to opinions expressed by others.

The Compound Media, Inc., an affiliate of Ritholtz Wealth Management, receives payment from various entities for advertisements in affiliated podcasts, blogs and emails. Inclusion of such advertisements does not constitute or imply endorsement, sponsorship or recommendation thereof, or any affiliation therewith, by the Content Creator or by Ritholtz Wealth Management or any of its employees. Investments in securities involve the risk of loss. For additional advertisement disclaimers see here: https://www.ritholtzwealth.com/advertising-disclaimers

Please see disclosures here.