The longest bear market didn’t begin in 1929 or 2007, but rather on January 11, 1973 [i]. The 437 days from peak-to-trough gave birth to many well-known value investors and also left in its wake a generation of brokers that would never return to Wall Street. Roger Lowenstein described how this period is remembered forgotten today.
The market collapse of 1973-74 has been oddly ignored in the annals of investing. Yet it was truly epochal, and on a par with the 1930s. [ii]
Aside from the fact that this was the longest bear market ever, here are five additional reasons why these 21 months were particularly brutal.
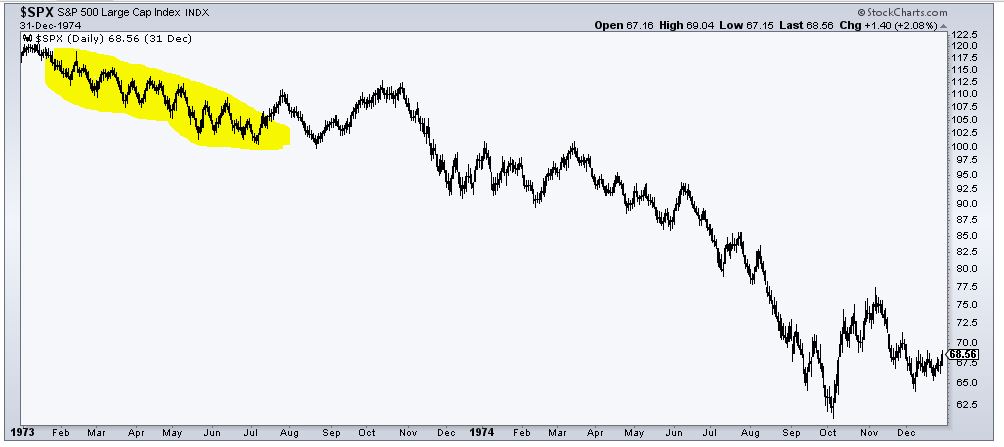
1) It occurred within the context of a massive secular bear market, one that made zero progress over a 16-year period.

2) 1973 alone saw 11 separate bounces of at least 5%; false hope just pours salt in the wound.
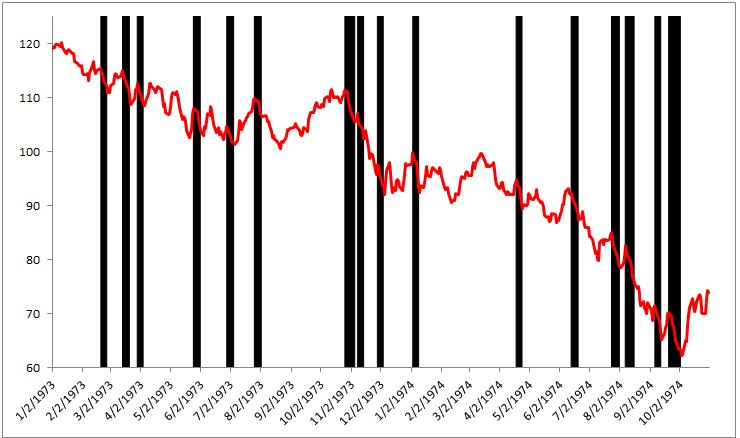
3) There were sixteen different 5-day losing streaks (black shaded lines). For comparison, the recent bear market from 2007-2009 experienced just four. The quote below is from a New York Times article published on September 1, 1974

4) With the exception of Gold, nominal returns were awful, real returns were worse. Stocks fell 16 of 21 months and the S&P 500 declined 7 straight months for the first and only time ever [iii]. And while large stocks did poorly, smaller stocks were basically wiped off the face of the earth. From the New York Times:
So far, the prolonged decline- since the end of 1968, the typical stock has dropped 70 per cent in value, according to a broadly based Value Line index- has meant lost confidence along with lost dollars for investors. [iv]

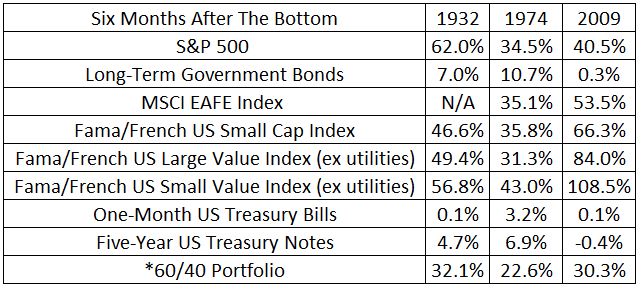
5) The snap back rally was weaker than the rebound after the Great Depression and the Great Recession.
The ’73-’74 bear market drove the CAPE ratio down to the lowest levels since 1942 (8.3) and provided investors with a rare fat pitch. This 8.3 CAPE is cheaper than 93% of all other periods going back to the beginning of the 20th century. It was truly a value investor’s dream; too many ideas, not enough cash. But despite the bargains, it would take another eight years for stocks to break out of this range, giving birth to the greatest bull market of all-time.
There are many lessons to be learned from this period but the main takeaway is that stocks can suck for a long, long time. Thinking that you’re mentally prepared for this type of environment is not enough. You must have a portfolio that truly matches your risk tolerance- not your risk tolerance today near all-time highs, but your actual risk tolerance. A properly constructed portfolio- one you can stick with through thick and thin, is what separates investors who can take advantage of cheap stocks versus those who get burned and never return.
[i] A bear market is reset when stocks experience a 20% bounce, so for instance, there were 14 separate bear markets from 1929-1955.
[ii] Buffett: The Making of an American Capitalist
[iii] I’m using the S&P 500 TR
[iv] Why This Bear Market is Different
* A 60/40 portfolio is 60% S&P 500 TR, 20% Long-Term Government Bonds, 12% Long-Term Corporate Bonds, 5% Five-Year Treasury Notes, 3% One-Month Treasury Bills. Data provided by Dimensional Returns 2.0.

