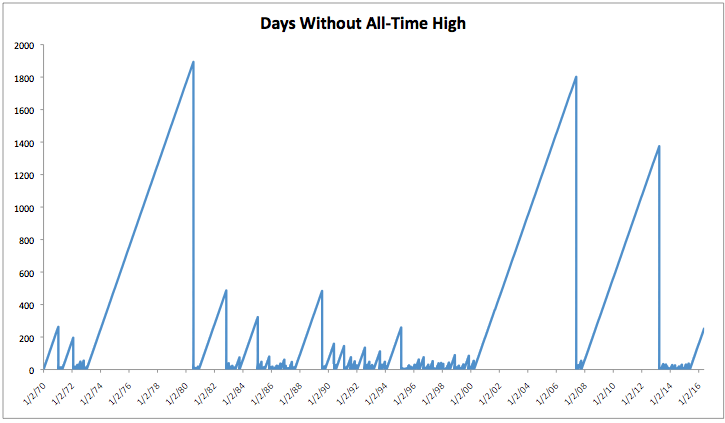
Since 1970, the S&P 500 has on average made a new all-time high every 38 days. It’s now been 252 days since this has happened (price only, not dividend adjusted).
And since the S&P 500 last made a new all-time high, many areas of the market have been put through the ringer.
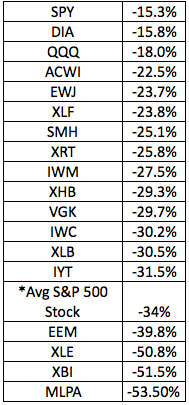
Below is a table showing some of the pain that was inflicted upon different sectors and geographies. The S&P 500- at -15.3% might not have fit the “definition” of a bear market, but don’t tell that to the average stock, which fell 34% from its 52-week high.
Entertaining as it may be, it’s mostly a waste of time trying to label what type of environment we’re in, because much of the time, like today, we’re in neither a bull nor bear market. As Josh Brown once said, “most of the time things are not bottoming or topping, they are middle-ing.”
*96 stocks made new lows on August 24th, many of which were flash-crashy prices
Michael Batnick is a managing partner at Ritholtz Wealth Management. He is the co-host of Animal Spirits, What Are Your Thoughts, and The Compound and Friends. For disclosure information please see here.
Get a Full Investor Curriculum: Join The Book List
Every month you'll receive 3-4 book suggestions--chosen by hand from more than 1,000 books. You'll also receive an extensive curriculum (books, articles, papers, videos) in PDF form right away.