The S&P 500 is about to wrap up its eight consecutive year of positive returns. If this continues into next year, it would match the longest streak of all-time. For some context, in the nine years from 1991-1999, the S&P 500 gained 450%; In the recent 8 year period, the S&P 500 is up 193%. In addition to strong performance from U.S. stocks, you’ve probably noticed that international stocks haven’t been keeping up. The S&P 500 has outperformed foreign developed markets during 7 of the last 9 years, gaining 85% over this time, while developed stocks around the world lost 4%.
After such a strong run, it’s easy for U.S. focused investors to get lulled into a false sense of security; That we’re in a stable environment. Do not be fooled.
I’m wrapping up 2016 with one of the best books I’ve read this year, Deep Survival by Laurence Gonzales. The book is about, as you might have guessed, how humans survive. There are so many parallels between the stories he tells and the markets, because survival is one of the most important goals for investors.
Perrow’s Normal Accidents, first published in 1984, is a work of seminal importance because of its unusual thesis: That in certain kinds of systems, large accidents, though rare, are both inevitable and normal. The accidents are a characteristic of the system itself, he says. His book was even more controversial because he found that efforts to make those systems safer, especially by technological means, made the systems more complex and therefore more prone to accidents.
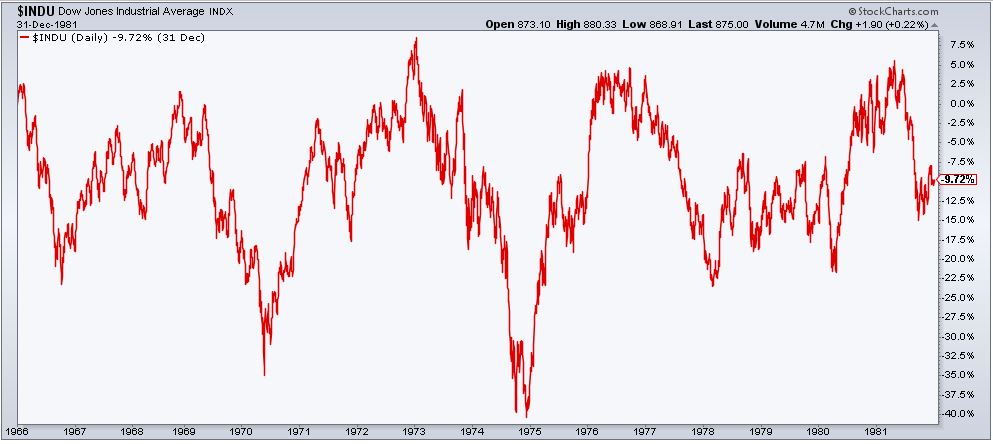
The stock market is a system where we can and should expect to experience normal accidents. I read a lot of market history, not because I think it gives me any better insight as to what the future will look like, but rather as a constant reminder of one thing, pain. For all the wealth that’s been created in the stock market, an equal amount of financial lives have been ruined. Take a look at the 16-year period where investors earned nothing and were rewarded with yo-yo like returns. Investors are promised nothing, be humble.
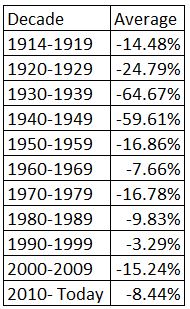
Let’s look at the hypothetical dollar that stayed invested from 1914-today. The table below breaks down how far away the market is from an all-time high by decade. The 1990s were incredible, 315 new highs and on average the Dow was just 3.3% from its all-time high. This was an incredible period, but we can see that investors have not always enjoyed such a comfortable ride.
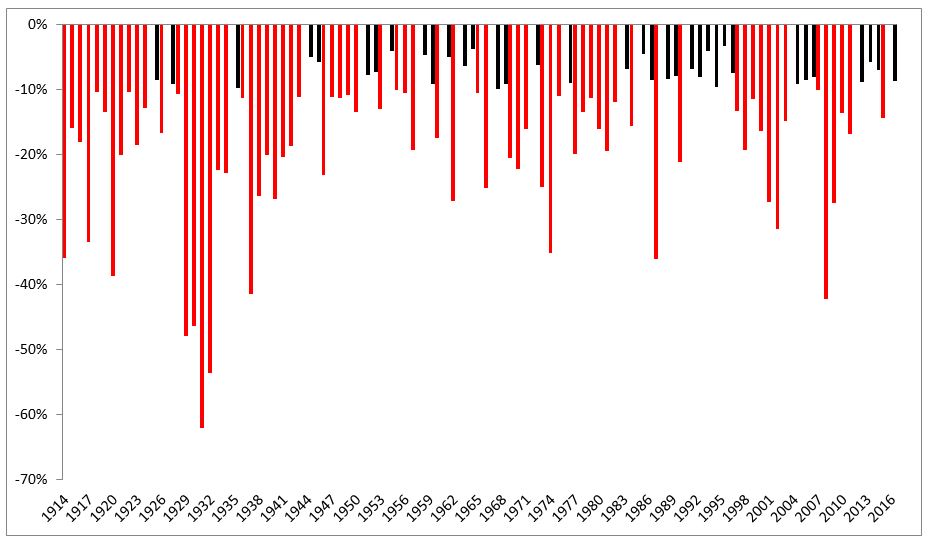
I can hear eyeballs rolling, nobody invests for 100 years. So I created another chart to show the max intra-year drawdown. Rolling returns might be better to show, but investors mentally reset each year and anchor to what their value is on January 1. The average max intra-year drawdown is -16.5% (the median is -12.8%). The black lines represent years in which the max drawdown was less than 10%. Double digits, in red, outnumber them 2:1.
The most mind boggling thing on this chart is the Great Depression. Imagine being the most optimistic person in the world who, when December 31 rolls around, is hoping for a better year to come. In 10 of the 12 years from 1929-1941 the Dow experienced a 20% intra-year decline. These are the numbers from 1929-1934: -48%, -46%, -62%, -54%, -22%, -23%. It’s hard to imagine experiencing that type of financial suffering year after year.
Successfully adapting to current market environments, and not being fooled by the last one is extremely difficult. Gonzales nails the concept of adaptation.
“Experience is nothing more than the engine that drives adaptation, so it’s always important to ask: Adaptation to what? You need to know if your particular experience has produced the sort of adaptation that will contribute to survival in the particular environment you choose. And when the environment changes, you have to be aware that your own experience might be inappropriate.”
So if we know that normal accidents are part of investing, and that it’s very difficult to successfully adapt, we need to remind ourselves of a few things:
- Never put yourself in a position to be a forced seller.
- Always keep enough cash to survive a rainy day, or rainy years. Do not worry about it being a drag on your returns. The drag is nothing compared to the permanent damage of selling after a deep drawdown.
- Everything looks good in a back test. Unfortunately there is no such thing as a front-test.
- Be honest with yourself. Are you taking too much risk? Expect U.S. stocks will experience an intra-year drawdown of 15%.
- Think in numbers, not percentages. If U.S. stocks fall by 30% or more, and I promise they will eventually, ask yourself if you can handle that? If you have $1,000,000 invested in U.S. stocks, a 30% decline means you will witness $300,000 disappear. I repeat, $300,000. If you don’t have the ability to sit through that, it’s better that you recognize it and do something now rather than fool yourself into thinking you can.
Best wishes for survival in 2017 and beyond.
Source:

