Robert Cialdini’s Influence: The Psychology of Persuasion, has removed any lingering doubt I had that we are reasonable creatures. Cialdini shares so many examples of experiments that at times I literally stood up in disbelief. Here’s a good one:
More compelling evidence for the importance of similarity in determining whether we will imitate another’s behavior comes from scientific research. An especially apt illustration can be found in a study done several years ago by Columbia University psychologists. The researchers placed wallets on the ground in various locations around midtown Manhattan to observe what would happen when they were found. The wallets all contained $2.00 in cash, a $26.30 check, and various information providing the name and address of the wallet’s “owner.” In addition to this material, the wallet also contained a letter that made it evident that the wallet had been lost not once, but twice. The letter was written to the wallet’s owner from a man who had found it earlier and whose intention was to return it. The finder indicated in his letter that he was happy to help and that the chance to be of service in this way had made him feel good.
It was evident to anyone who found one of these wallets that this well-intentioned individual had then lost the wallet himself on the way to the mailbox—the wallet was wrapped in an envelope addressed to the owner. The researchers wanted to know how many people finding such a wallet would follow the lead of the first finder and mail it, intact, to the original owner. Before they dropped the wallets, however, the researchers varied one feature of the letter it contained. Some of the letters were written in standard English by what seemed to be an average American, while the other letters were written in broken English by the first finder, who identified himself as a recently arrived foreigner. In other words, the person who had initially found the wallet and had tried to return it was depicted by the letter as being either similar or dissimilar to most Americans.
The interesting question was whether the Manhattanites who found the wallet and letter would be more influenced to mail the wallet if the first man who had tried to do so was similar to them. The answer was plain: Only 33 percent of the wallets were returned when the first finder was seen as dissimilar, but fully 70 percent were returned when he was thought to be a similar other. These results suggest an important qualification of the principle of social proof. We will use the actions of others to decide on proper behavior for ourselves, especially when we view those others as similar to ourselves.
We are so easily influenced that it’s no wonder why marketing is one of the biggest businesses in the world. eMarketer estimates that in 2016, total media global advertising would hit $542,550,000,000, which is just about equal to the combined revenue of Amazon, Apple, and Berkshire (over the last twelve months). Investors, naturally, are a large piece of that pie; A 2013 study by the Consumer Financial Protection Bureau showed that financial service companies spent $17 billion in marketing.
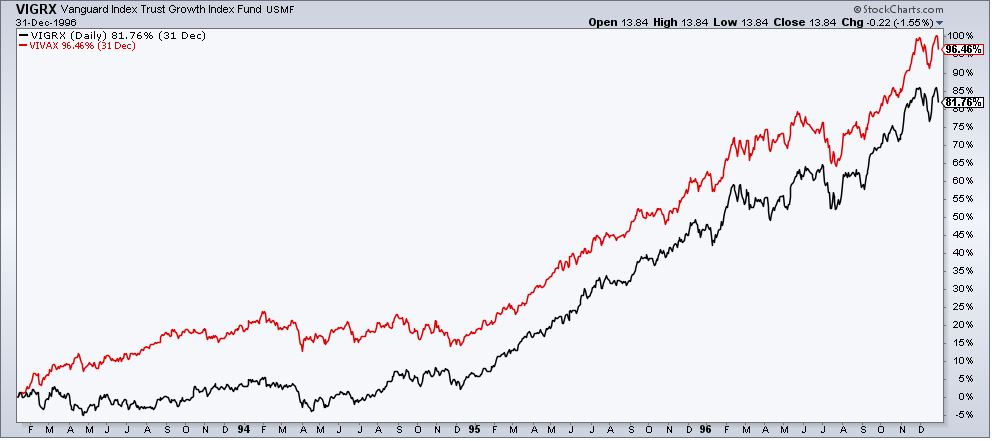
Today there are all sorts of Smart Beta products that are constantly jockeying for our dollars: dividend growth, high dividend, high beta, value, growth, momentum, low vol, small, and quality, to name a few. I’m fairly open-minded, but when it comes to this, I’m not sure I can be convinced that these products will be additive to investor’s returns. To see why, let’s look at the original “Smart Beta” products which came to the market at the end of 1992. The Vanguard Value Index Fund and the Vanguard Growth Index Fund are no frills, low cost ways to access different segments of the stock market. Below, we go on a short journey through different market regimes that these funds and investors have experienced.
Over the first four years, value outperformed by 15%.
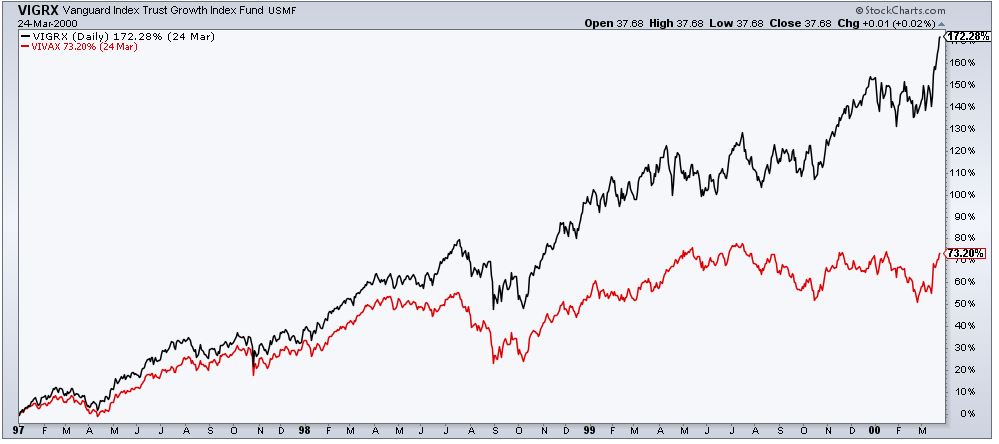
Over the next four years, as the the tech bubble inflates, value got crushed, relative to growth.
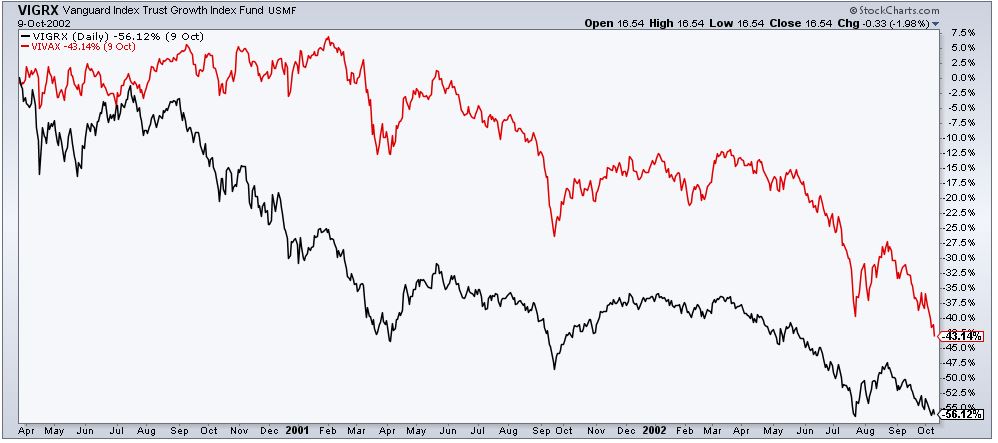
As the air came out of the bubble, both value and growth get killed, value to a lesser extent.
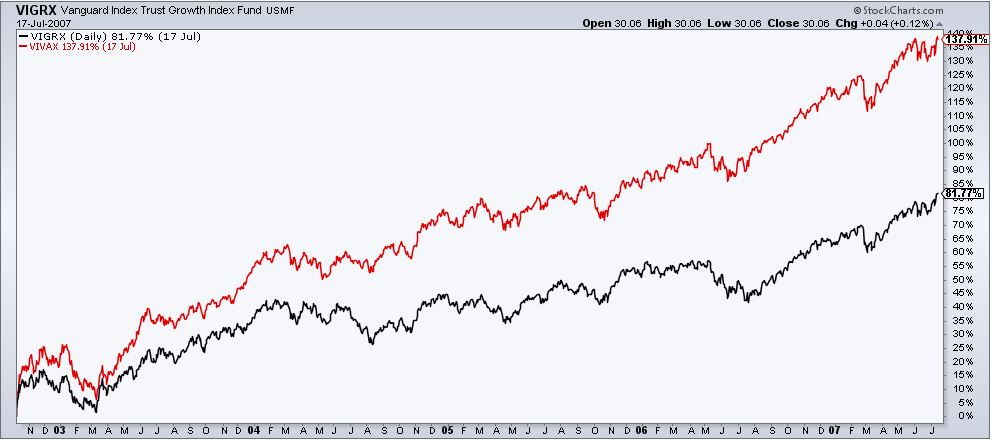
From the bottom of the tech bubble and leading up to the peak of the credit bubble, it was value investor’s turn to outperform.
Once again, when the air came out, both value and growth get killed. This time, it was growth that delivered slightly less disastrous returns.
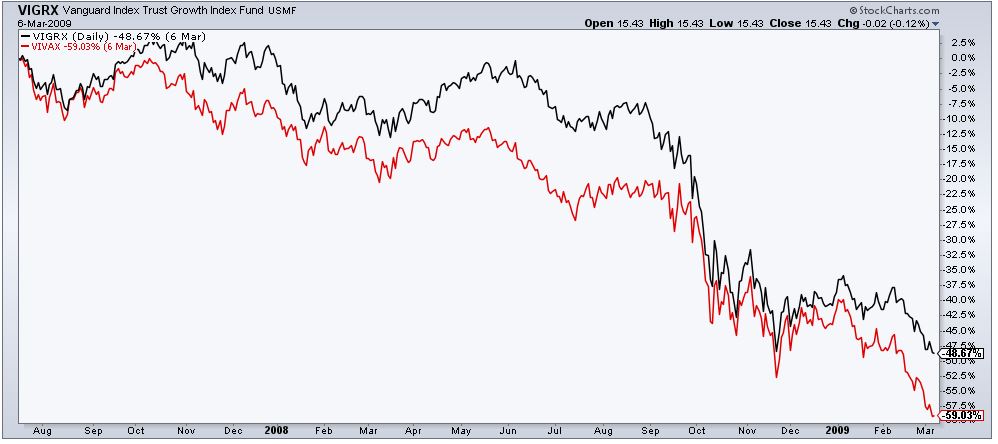
From the bottom in March 2009 through today, the path of returns and the final results have been virtually identical.
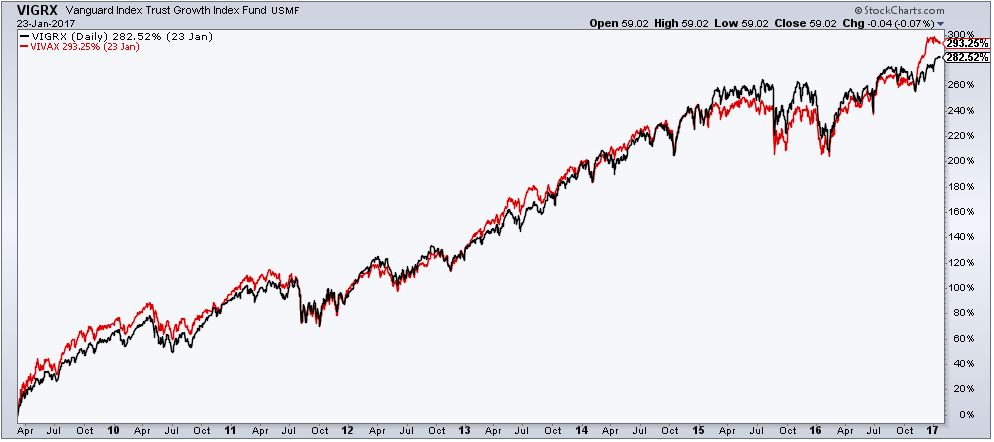
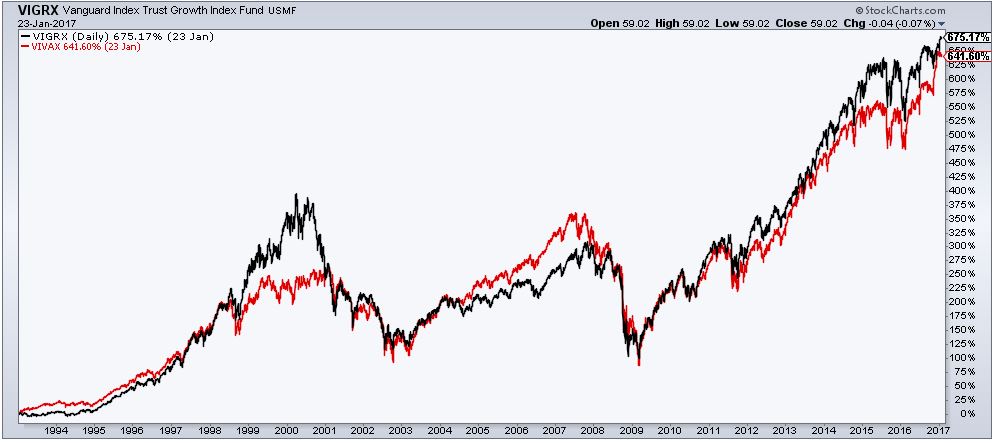
In fact, since these products came to market, the returns are for all intents and purposes, the same; 641% for value and 675% for growth.
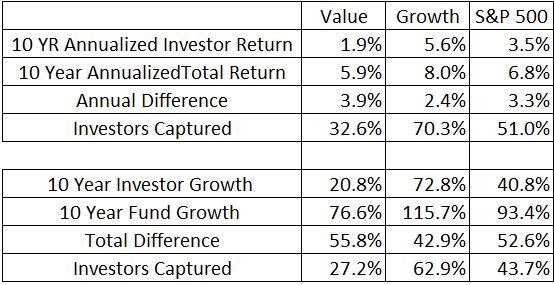
The table below shows the results all the zigging and zagging had on investor’s returns. I’ll take value, and explain what some of these numbers mean. Over the last ten years, investors in the Value Index Fund earned 1.9% annually, while the fund itself earned 5.9%. In other words, investors captured only 32.6% of these returns each year. Over the last ten years, investors in the Value Index Fund earned a total of 20.8%, while the fund itself earned 76.6%. The 55.8% difference means that investors in the fund captured just 27.2% of the total return that was available over that period.
Explaining things in percentages doesn’t always do a good job emphasizing the true monetary effects so let’s look at it like this- Had Vanguard gated the $4.4B and $6.7B in the funds ten years ago, investors in the value fund would have $2.5B more and investors in the growth fund would have $2.9B more. That’s $5.3B investors left on the table due to poor behavior. And this is Vanguard, a company that prides itself on buying and holding and not timing the market. If people can’t capture the returns these simple funds have to offer, what chance do investors have in today’s new and more complex products?
I do believe that some of the Smart Beta strategies can generate superior results than the cap weighted index, but I am very skeptical that investors will behave any differently than the people picking up the lost wallets. The proof is in the pudding, so I’ll end this with some words from Jack Bogle (emphasis mine).
“During the volatile first quarter of 2016, trading in ETFs rose to new heights, virtually equaling the trading in individual stocks. The dollar volume of trading in the 100 largest ETFs was $4.34 trillion, while the volume in the 100 largest individual stocks was $4.46 trillion. Given the far smaller market capitalization of these ETFs ($1.5 trillion vs. $13 trillion), the annualized turnover of ETFs was 1100%, while the annualized turnover of stocks was 140%. Since excessive trading is the enemy of the investor, this trend troubles me deeply. Indeed, when Nathan Most, creator of the ETF, proposed to me in 1992 that we join forces and offer Vanguard’s original S&P 500 Index Fund as the medium for his creation, I declined his offer. I upheld the buy-and-hold principle on which our index fund was founded. I do not regret my decision.”
Source:

