The S&P 500 fell 57.69% from October 2007 to March 2009, but real earnings fell even more, from a high of $98.43 in June 2007 to a low of $8.01 in April 2009, a 91.86% decline.
Some might think that this historical collapse is inflating the CAPE ratio. In other words, if real earnings didn’t experience their deepest drawdown ever, stocks wouldn’t appear so expensive. I wish this were the case.
Play along while I make a few assumptions:
First, I took the peak pre-crisis earnings of $98.43 and replaced the next 75 months with that number (that’s how long it took to get back above $98.43).
Second. in Shiller’s data set, earnings are only available through September 2016. So for the most recent six months I grew real earnings by an annualized 3%.
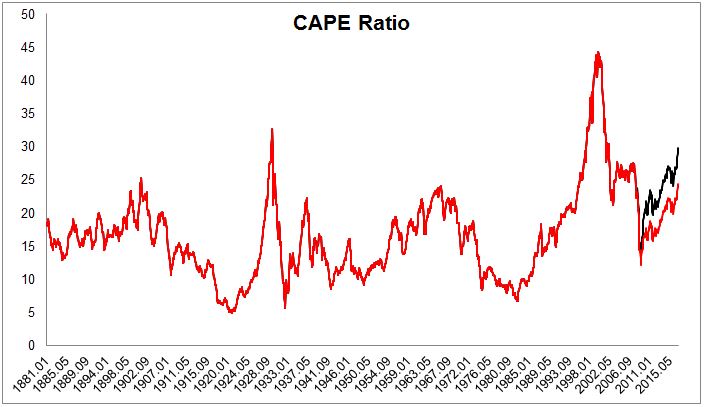
Even with these assumptions, the CAPE ratio would stand at 24.4. Lower than the current reading of 30, but still hardly a bargain. The red line (until the divergence) is the actual CAPE ratio, but after it represents the assumptions that earnings never fell. The black line is where we really are today.
I’m not a big fan of saying stocks are overvalued, not just today, but more generally speaking. It implies two things: One, that I know something the market doesn’t (I don’t) and two, stocks have to come a long way down to be fairly valued (maybe, maybe not). I’m much more comfortable saying that stocks are more expensive than they have been in the past and it would be wise for people investing in U.S. stocks to expect lower returns in the future.
Michael Batnick is a managing partner at Ritholtz Wealth Management. He is the co-host of Animal Spirits, What Are Your Thoughts, and The Compound and Friends. For disclosure information please see here.
Get a Full Investor Curriculum: Join The Book List
Every month you'll receive 3-4 book suggestions--chosen by hand from more than 1,000 books. You'll also receive an extensive curriculum (books, articles, papers, videos) in PDF form right away.