A recent WSJ report says that “Revenues at HFT firms from U.S. equities trading were an estimated $1.1 billion last year, down from $7.2 billion in 2009.” That’s an 85% decline in under a decade! When it comes to business and markets in particular, edges don’t last very long. The brilliant mathematician Benoit Mandelbrot said it best, “Winning strategies tend to have a brief half-life.”
If this is the case, then what should investors make of the explosive rise in smart-beta strategies? Won’t every potential advantage they offer be arbed out by their popularity? Maybe. But maybe not.
Below is a chart of the equity risk premium, which shows the annual difference between U.S. stocks and U.S. T-Bills. The reason it’s called a premium is because you get paid, or at least historically, have gotten paid to take risk in the stock market. On average, the annual returns of U.S. stocks has exceeded T-Bills by 8.5% and had a greater return in 61 out of 91 years, or 67% of the time.
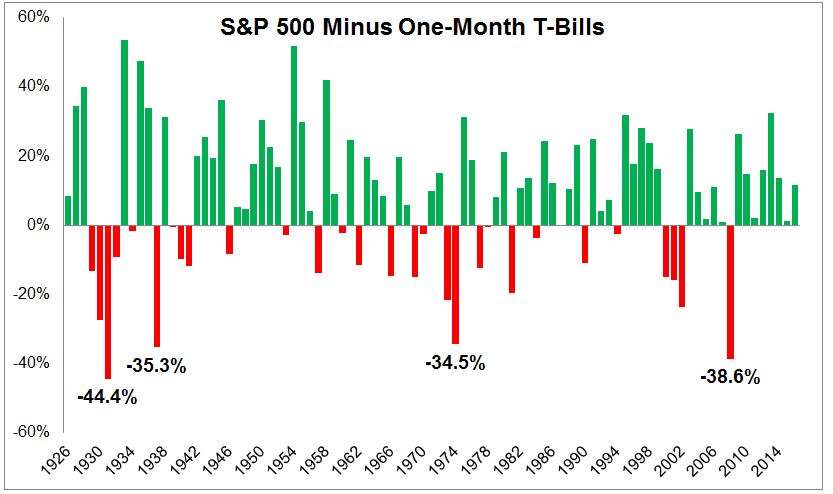
But why is it that the advantage of holding stocks hasn’t been arbed away? It’s not as if investors have only recently discovered that stocks are risky. The reason why stocks have continued to pay is because of those big red bars, and as long as they show up in the future, which is is one of the few things in investing I feel certain of, then risk takers should expect to be compensated .
The chart below shows the same thing as the previous one, but here we’re looking at rolling twelve-month periods, which gives us more than a thousand readings. Not surprisingly, the numbers are similar to calendar years; Stocks have outperformed 69% of the time.

So 30% of the time investors haven’t gotten paid to take risk. In fact, many times taking risk destroyed them, because sometimes, that’s just what risk does. I don’t know how much investors are going to be paid in the future for taking risk, but I suspect that the next fifty years will look a lot like the previous fifty years (of the second chart); Up and down and up and down and up and down….
Returning to smart-beta; Whether these factors even offer a premium is a whole other debate, but I think the risky nature of them still leaves opportunity for disciplined investors. Let’s look at one of the more popular strategies, low-vol. In 2016, this got off to a really hot start, outperforming the S&P 500 by 8% in the first seven months of the year.
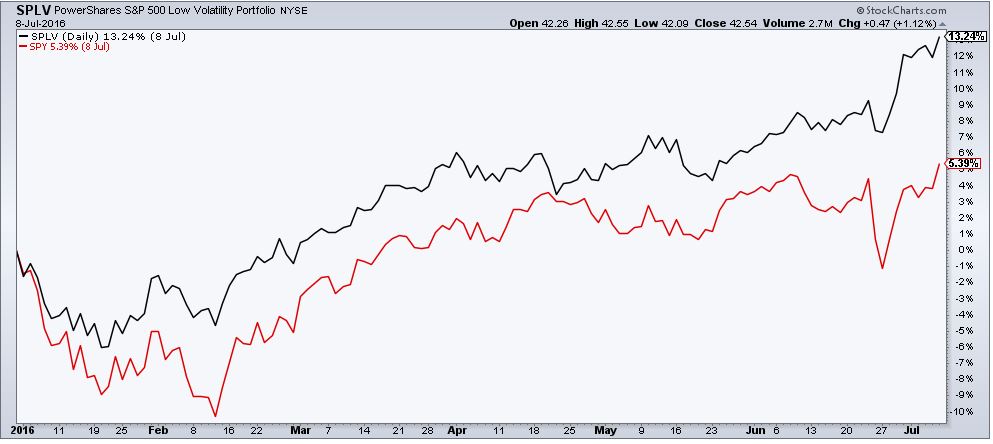
But then in the following seven months, there was a reversal of fortune and low-vol underperformed the S&P 500 by 9%.
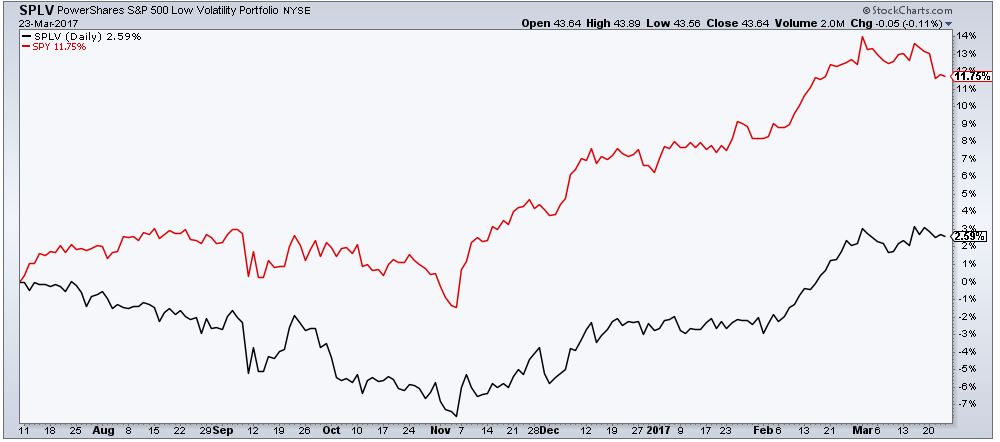
And investors did what they have been doing since the beginning of time. In the first chart, when low-vol was doing well, $1,354,750,000 poured in, and then when the tide came out, so did investors, pulling out $1,737,700,000, around 20% of total assets.
I don’t know how the rise of smart-beta strategies will impact value stocks going forward, but I’m confident that returns will continue to flow from those that are active to those that are patient. If you want to hear the thoughts from a pioneer in factor investing, listen to the Invest Like the Best podcast with Jim O’Shaughnessy, who said “If you don’t have the discipline to stick with your underlying strategy particularly when it’s not going in your favor, it’s nothing. It’s data on a page.”
Source:

