April has historically been a very good month for stocks, with the first two weeks in particular standing out. The average gain in the first half of April, according to a MarketWatch column, is 1.2%, compared with an average gain of 0.2% for all other months.
Is there something to the IRS effect? I don’t know, maybe, that does seem like an oddly large outlier. But then how do we explain the strength in the first two weeks of July, which averages gains of nearly 1%?
These statistics make for good blog posts, but that’s about it. I can’t imagine anybody changing their portfolio in any way, shape, or form because April has historically been a strong month.
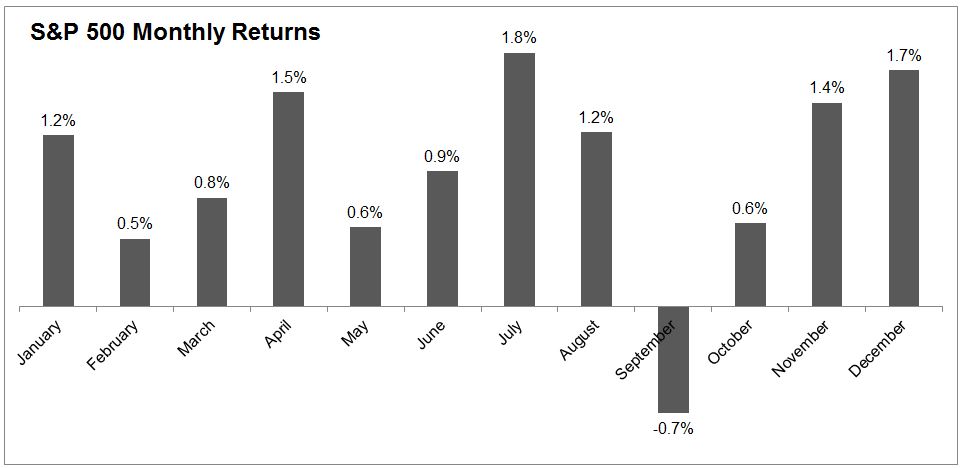
Below are the average 91 monthly returns going back to 1926. At 1.5%, April has been the third best performing month. But….
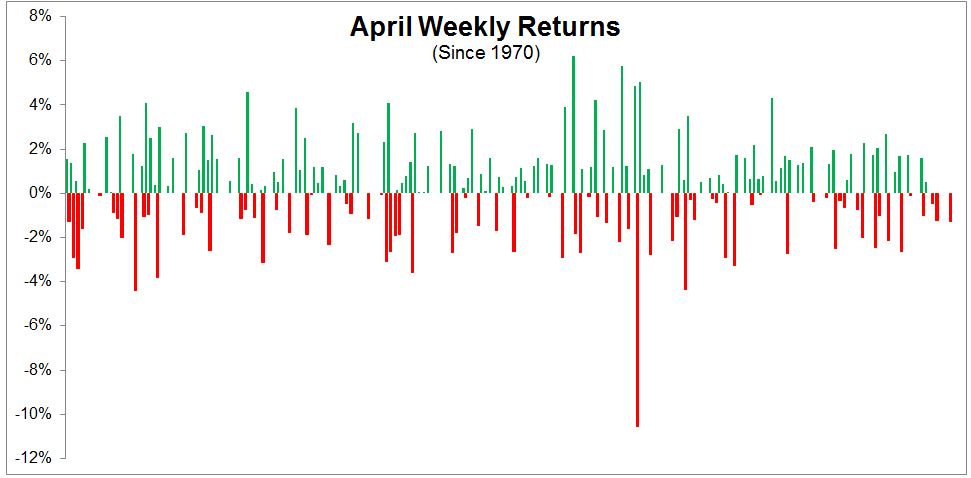
Like everything else in investing, it’s easy to look back at monthly or yearly periods and craft a false narrative, because the day-to-day or week-to-week gets lost in the data. Below are the weekly April returns going back to 1970. I’m pretty sure that the strength in April didn’t matter to investors in 2000, when they dumped stocks to the tune of 10.5%.
If we can learn anything from silly statistics like this, it’s how trivial the long-term is if you can’t survive the short-term.
Michael Batnick is a managing partner at Ritholtz Wealth Management. He is the co-host of Animal Spirits, What Are Your Thoughts, and The Compound and Friends. For disclosure information please see here.
Get a Full Investor Curriculum: Join The Book List
Every month you'll receive 3-4 book suggestions--chosen by hand from more than 1,000 books. You'll also receive an extensive curriculum (books, articles, papers, videos) in PDF form right away.