Today, Netflix celebrates its fifteenth year as a public company. In 2002, the DVD rental service raised $82.5 million, just 2.5% of what SNAP did in March, 2017. But these are different companies and certainly different times. In May 2002, the NASDAQ was 67% off its highs and fewer companies were coming public, as the chart below shows.
Netflix has done incredible things for its customers and for its shareholders, or share traders, anyway. Over the last fifteen years, Netflix is up 14,500%, the NASDAQ 100 is up 383%, and consumer discretionary stocks are up 268%.
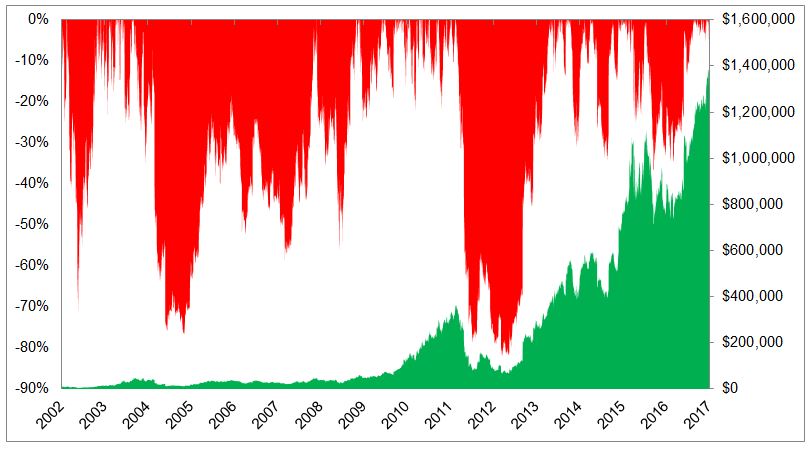
Netflix has had triple digit returns in five of the last fourteen years, was the best performing S&P 500 stock in 2013, and 2015, and it’s up 27% in 2017. But oh boy, riding this stock, as is the case with every gigantic winner, has been extremely difficult. The chart below shows the growth of $10,000 in green, and the drawdowns in red.
Netflix was never accused of being a value stock, but it was expensive for good reason. I suppose a better way to say this is that it was cheap based on expectations, but expensive based on traditional valuation metrics. The last time Netflix traded at a P/E less than 100 was early 2015.
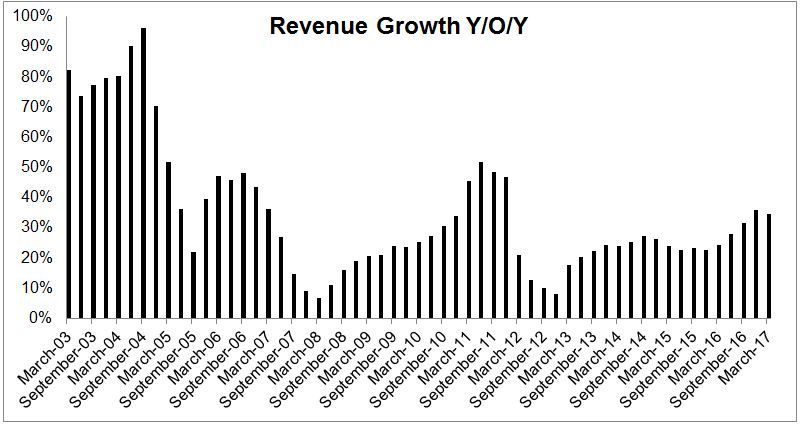
Netflix has grown its revenue more than 20% for 16 straight quarters. There is no way for me to quickly verify this, but I’d guess not too many companies north of $50 billion are doing this.
Who knows what the next fifteen years holds for this company, but as a user, and an S&P 500 index owner, I’m certainly rooting for them.
Michael Batnick is a managing partner at Ritholtz Wealth Management. He is the co-host of Animal Spirits, What Are Your Thoughts, and The Compound and Friends. For disclosure information please see here.
Get a Full Investor Curriculum: Join The Book List
Every month you'll receive 3-4 book suggestions--chosen by hand from more than 1,000 books. You'll also receive an extensive curriculum (books, articles, papers, videos) in PDF form right away.