There are new investment products hitting the shelves every week. This fierce competition amongst asset management companies is driving down expense ratios, but investor’s are potentially paying higher costs. There are 50 U.S. Large Cap ETFs with over $500 million in assets, which means there will always be something in that category doing better than what you’ve selected.
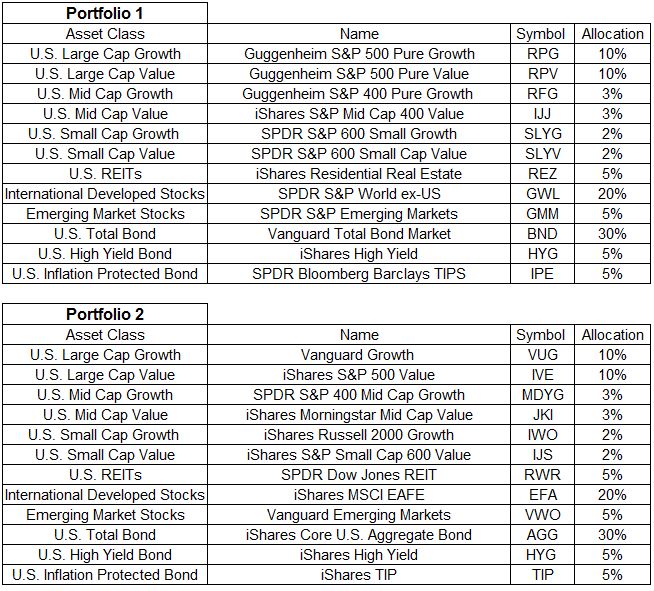
Below are two nearly identical portfolios; both are sixty percent stocks and forty percent bonds. Each portfolio has twelve slices, with identical allocations in each sleeve. The only thing that’s different about them are the holdings. For example, portfolio 1 has a 10% position to U.S. Large Cap Growth, represented by RPG from Guggenheim. Portfolio 2 also has a 10% position to U.S. Large Cap Growth, except it gets its exposure through Vanguard’s VUG. Before we look at how these portfolios have performed, I need to caveat this by saying this is not what I view to be an “optimal” portfolio, it is not something I recommend. Not every asset class is included, there are no commodities, foreign bonds, or cryptocurrencies. This is for illustrative purposes only (HYG is the only overlap).

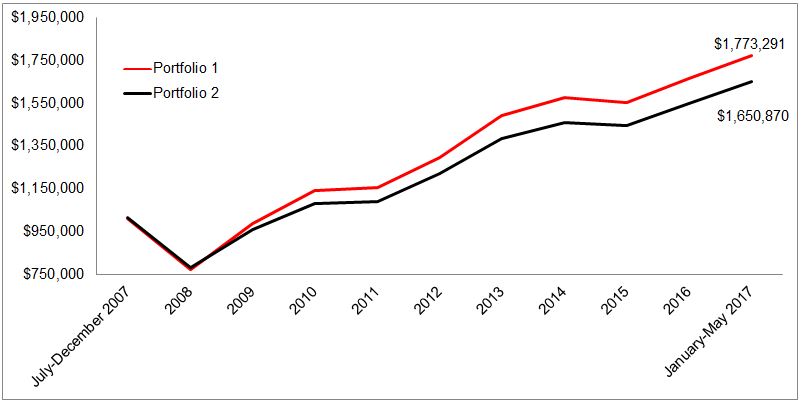
Portfolio 1 returned 5.95% per year, or 77% over this 10-year period. Portfolio 2 returned 5.19% per year, or 65% over the same time (The earliest common inception date for these portfolios are July 2007.).

The table below shows the best and worst 1 and 3-year periods. You’ll notice they’re very comparable, what put a little bit of space between them was the rebound in the twelve months following the 2009 bottom.

Portfolio 2 was mostly random, I didn’t put much thought into the funds I selected. Here’s the kicker; Portfolio 1 was selected using each of the best performing ETFs over the last ten years. The optimal portfolio given the assets I selected outperformed one that required zero thought by just 0.76% a year. The good enough portfolio captured 93% of the value as the perfect portfolio.
Creating the proper asset allocation and staying with it has a much bigger impact on your returns than selecting the best performing funds within those asset classes. The chart below is visual evidence of this. Portfolio 2 sold after the 23.3% decline in 2008, sat out 2009, and returned to the model in 2010. Portfolio 3 also sold after 2008, but it waited two years and returned to the model in 2011. This type of behavior kills returns. If you’re going to run away from risk after it’s already taken a bite out of your portfolio, you shouldn’t be investing, period.

I’m not saying the pieces don’t matter, of course they do. I’m just saying the pie is way more important. The good enough portfolio can get you 90% of the way there. Sticking with it will give you the other 10%.

