Last night, David Schawel pointed out that the worst year for the Barclays Aggregate Bond Index was -2.9%. I’ve written in the past that a bad year for bonds is a bad week for stocks, but I was still surprised to learn just how shallow the worst calendar year was.
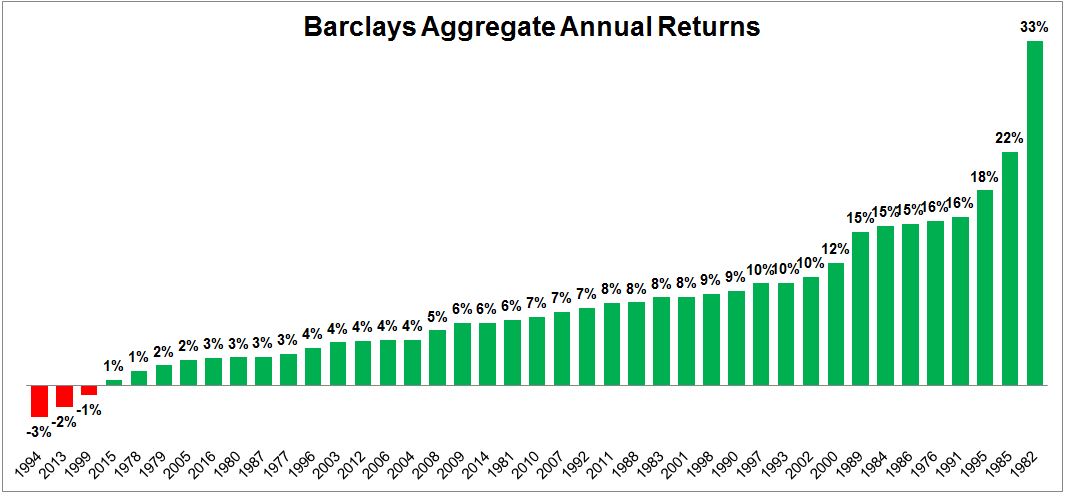
You might say, well duh, bonds have been in a bull market for thirty years. Fair, so let’s look back at the period from 1950-1981, when the ten-year rate went from 2% to 15%.
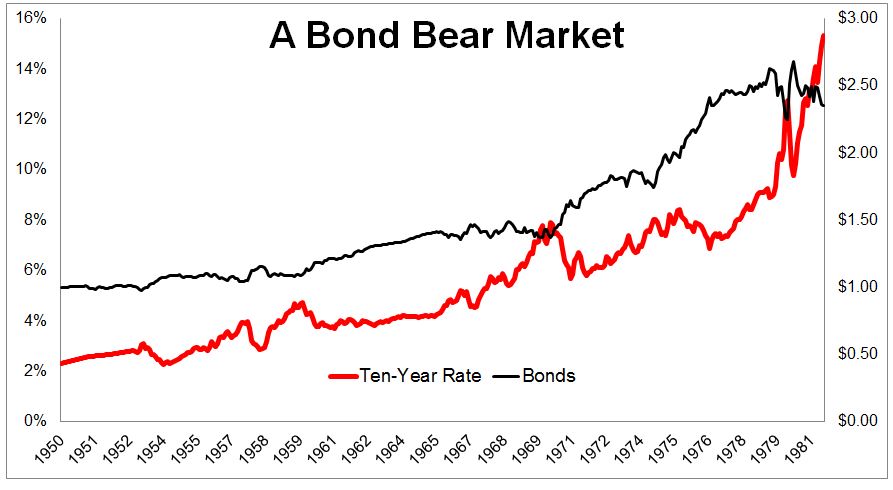
A portfolio of five-year notes (20%), long-term government bonds (35%), long-term corporate bonds (30%) and one-month t-bills (15%) returned 2.7% a year for this 32 year period. Not great- especially after inflation, but these are returns you could live with, when you consider that stocks returned 10.8% a year over the same time. The chart below shows the ten year screaming higher (red) and the growth of $1 (black). Here’s proof that rates can rise without bonds going to zero.
I’m not trying to dismiss people’s concerns over bonds. At low rates, it makes sense to prepare for the fact that future returns won’t be as large as they have been in the past. But, and this is the important part, stocks will always represent the biggest risk to your portfolio. And by risk I don’t mean permanent loss of capital, but rather the wild swings that cause you to run for the hills. That’s risk.
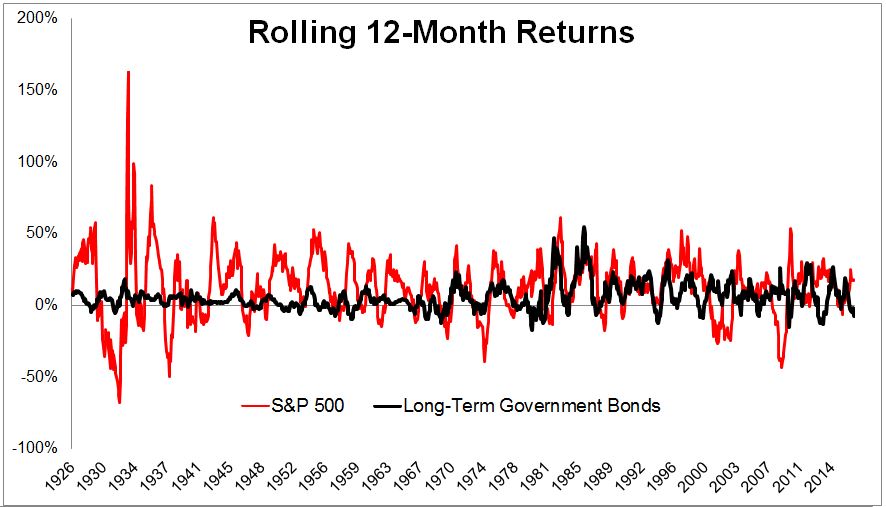
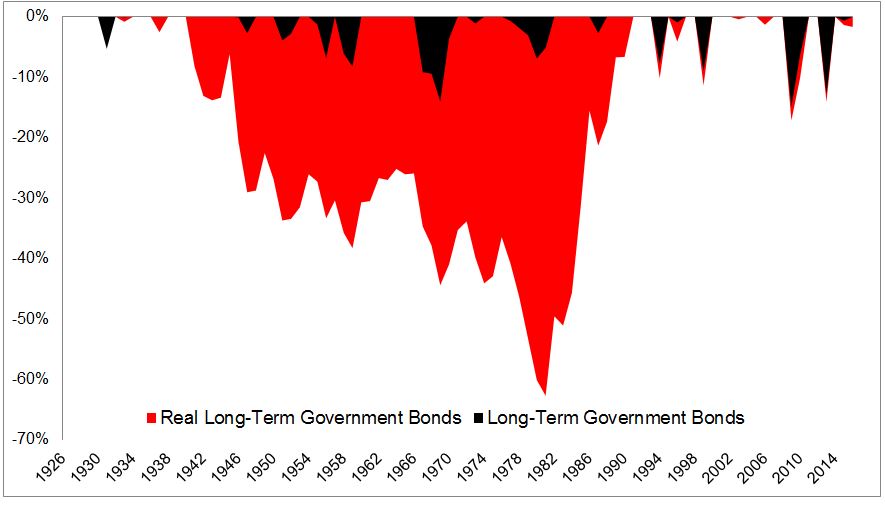
The chart below shows how much more volatile stocks have been historically than long-term government bonds (these bonds are highly sensitive to interest rates).
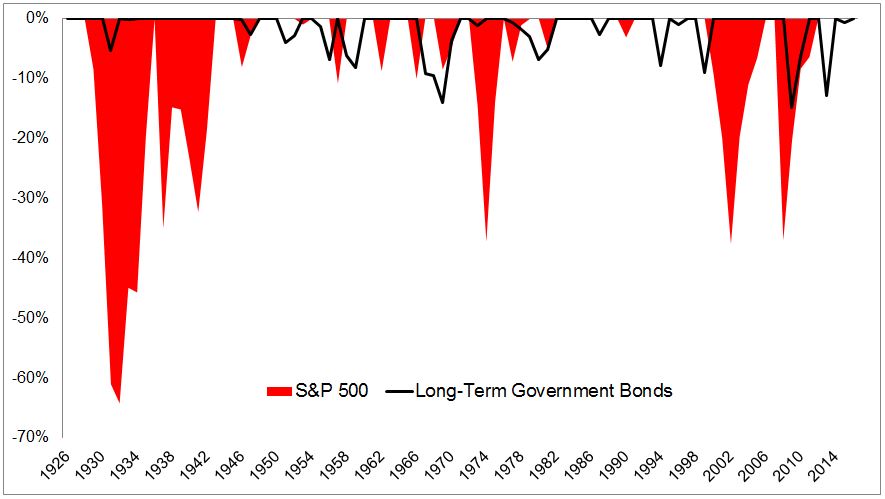
The losses investors have felt from high quality bonds were nothing compared to stocks, and they did not show up on their statements…
The real losses were caused by inflation. If you bought long-term government bonds in 1940, forty years later, your dollar was worth $0.37, and you weren’t made whole until 1991!
If you’re scared about bonds getting killed, take a look at the next two charts. The image below shows the ten worst years for long-term government bonds, and how stocks performed in the same year. Stocks were positive in eight of the ten years, and were up 20% or more in six of the ten years.
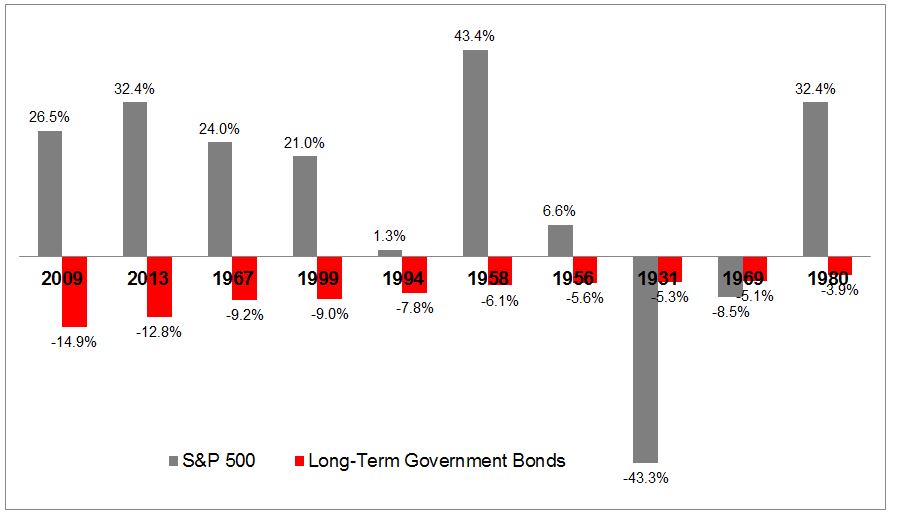
If you were 100% invested in bonds, these years stung. But if you were in a balanced portfolio, you would have done just fine.

The important questions that investors need to ask are why do I own bonds, and what purpose are they serving in my portfolio?
In my view, there are two main reasons to own bonds today. First, they should provide stability in the event of a shock to the stock market (high quality bonds, that is). Second, when this happens, they are your financial and emotional dry powder. For example, if you’re in a 60/40 portfolio and stocks fall 20% and bonds gain 5%, you’re now 53/47. Having bonds allows you to set pre-determined rules to minimize the mental drag of bad decisions. Make rules ahead of time, like when 60/40 becomes 55/45, rebalance out of bonds and into stocks. This mechanical approach forces you to buy low over time.
From 1976 until today (inception of Barclays Aggregate Bond Index), a 60/40 portfolio has returned 10.2% a year. I feel pretty confident that it won’t experience the same returns going forward, but I still believe bonds should still play an important role in investor’s portfolios.

