A Few Charts and a Few Thoughts

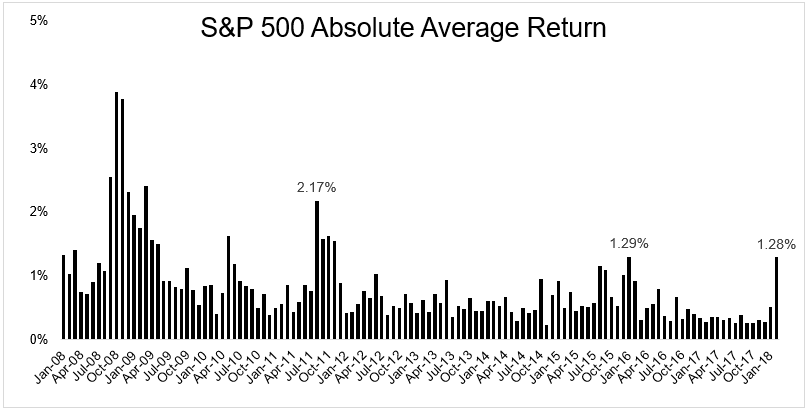
February was the most volatile month for stocks since January 2016. The average absolute daily return was 1.28%. This is more than triple the average absolute daily change over the previous 24 months.

Look to the left side of the chart for what extreme volatility looks like. The average absolute daily change in October and November of 2008 was nearly 4%. By comparison, February was a walk in the park.

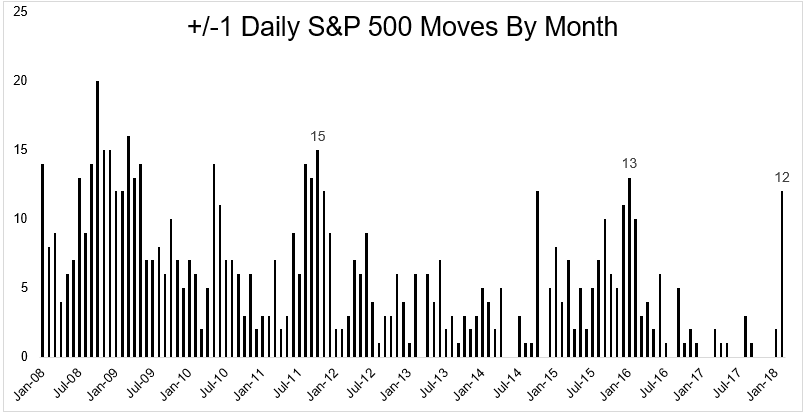
There were 12 days last month when the S&P 500 fell or rose by more than 1%, again the highest reading since January 2016.

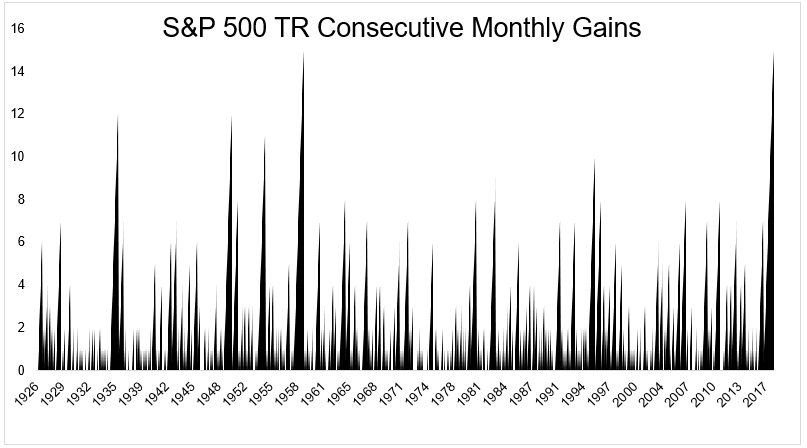
The S&P 500 total return index fell 3.7% in February, ending a record tying streak of 15 consecutive monthly gains.

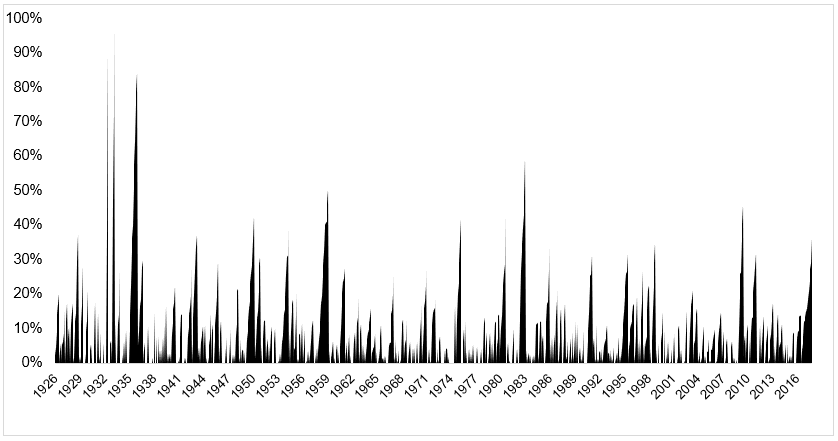
While stocks went up for a long time, their advance was rather tepid. The S&P 500 TR closed higher for 15 straight months, but the 36% advance, as shown in the chart below, ranks just 32nd in terms of percentage gain over consecutive months.

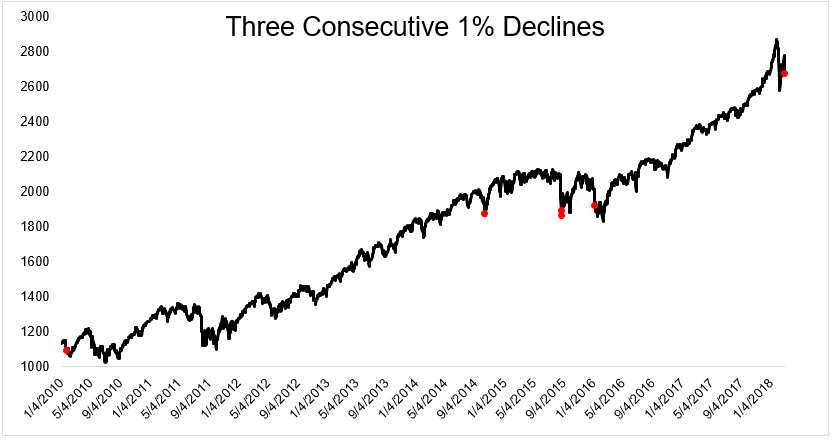
March is picking up where February left off. For the first time since January 2016 and just the fifth time since 2010, the S&P 500 declined for three consecutive days.

The S&P 500 has closed up or down at least 1% for five straight days for the first time since June 2016.

The period of market tranquility was buried a few weeks ago. Since that time, stocks have been running around the screen like a drunken sailor. It may take a while for them to sober up.

This content, which contains security-related opinions and/or information, is provided for informational purposes only and should not be relied upon in any manner as professional advice, or an endorsement of any practices, products or services. There can be no guarantees or assurances that the views expressed here will be applicable for any particular facts or circumstances, and should not be relied upon in any manner. You should consult your own advisers as to legal, business, tax, and other related matters concerning any investment.

The commentary in this “post” (including any related blog, podcasts, videos, and social media) reflects the personal opinions, viewpoints, and analyses of the Ritholtz Wealth Management employees providing such comments, and should not be regarded the views of Ritholtz Wealth Management LLC. or its respective affiliates or as a description of advisory services provided by Ritholtz Wealth Management or performance returns of any Ritholtz Wealth Management Investments client.

References to any securities or digital assets, or performance data, are for illustrative purposes only and do not constitute an investment recommendation or offer to provide investment advisory services. Charts and graphs provided within are for informational purposes solely and should not be relied upon when making any investment decision. Past performance is not indicative of future results. The content speaks only as of the date indicated. Any projections, estimates, forecasts, targets, prospects, and/or opinions expressed in these materials are subject to change without notice and may differ or be contrary to opinions expressed by others.

The Compound Media, Inc., an affiliate of Ritholtz Wealth Management, receives payment from various entities for advertisements in affiliated podcasts, blogs and emails. Inclusion of such advertisements does not constitute or imply endorsement, sponsorship or recommendation thereof, or any affiliation therewith, by the Content Creator or by Ritholtz Wealth Management or any of its employees. Investments in securities involve the risk of loss. For additional advertisement disclaimers see here: https://www.ritholtzwealth.com/advertising-disclaimers

Please see disclosures here.