Over the last nine years, the NASDAQ 100 gained 55%, 20%, 3%, 18%, 37%, 19%, 9%, 7%, 32%.
These numbers are insane. But the past is the past and today’s question is whether the recent selling is the beginning of the end, or just another shakeout? The chart below shows that all of the FAANG stocks are down at least 10% from their highs, with the exception of Apple.
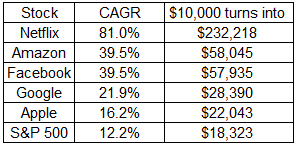
The returns for these five favorites since 2013 have been astronomical. Netflix is up 2,150% since 2013, compounding at 81% per year! The growth (of $10,000, sorry) in all of these names has been nothing short of remarkable.
If you told yourself you were a long-term investor in one or more of these stocks and you’re feeling a little jittery right now, I got some bad news for you. This ain’t nothing. These charts were so extended that this sort of bludgeoning is just part of the deal. Netflix can fall 40% from its highs a few weeks ago and still be up on the year.
It’s easy to look at a long-term chart of Netflix and beat yourself up for not owning it, but there’s a world of difference between looking for the next Amazon and holding onto the current one. If you want to learn how to ride a long-term winner, I highly recommend this terrific podcast with Patrick O’Shaughnessy and David Gardner.
Michael Batnick is a managing partner at Ritholtz Wealth Management. He is the co-host of Animal Spirits, What Are Your Thoughts, and The Compound and Friends. For disclosure information please see here.
Get a Full Investor Curriculum: Join The Book List
Every month you'll receive 3-4 book suggestions--chosen by hand from more than 1,000 books. You'll also receive an extensive curriculum (books, articles, papers, videos) in PDF form right away.