When you think about the worst periods in stock market history, you think about the Great Depression, the Great Recession, and probably 1973-1974. What often gets overlooked is the bear market of 1969-1970.
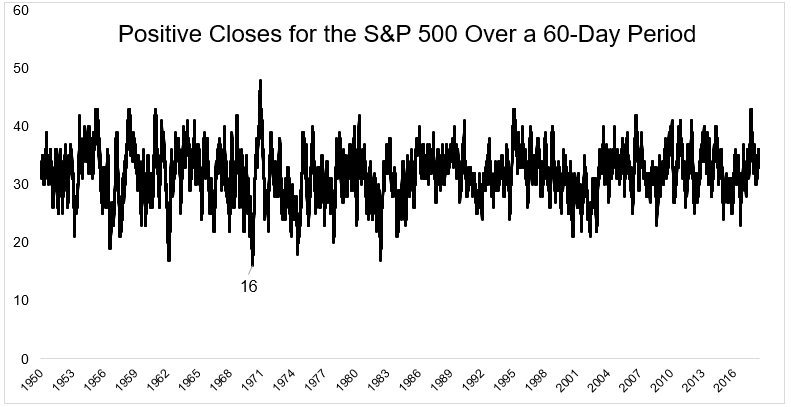
Over a 60-day period from March 3, 1970 through May 26, 1970, the S&P 500 finished higher only 16 times. This admittedly rather trivial data point is the lowest number of positive closes over a sixty-day period over the last 50 years.
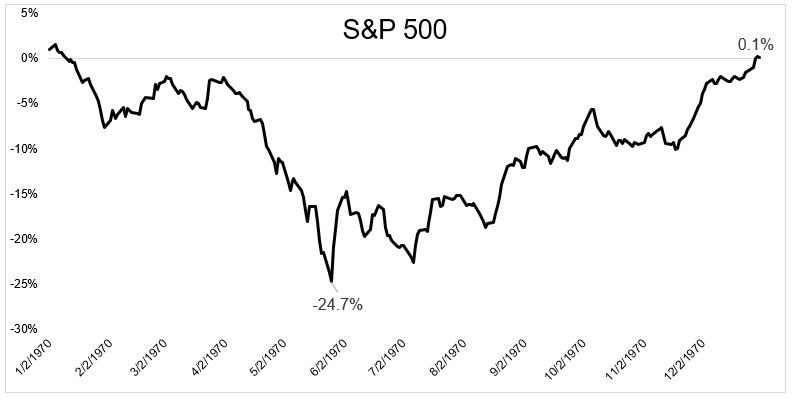
Below you can see the chaotic course stocks charted during the year. Things got off to a brutal start, but remarkably, stocks finished the year slightly higher. Filed away in things that never change, on the day the market bottomed, The New York Times wrote: “Volume ran moderately heavy at 12.66 million shares, but it was far short of any “selling climax,” which some market analysts say may be required before any remaining weakness is wrung out of the market.”
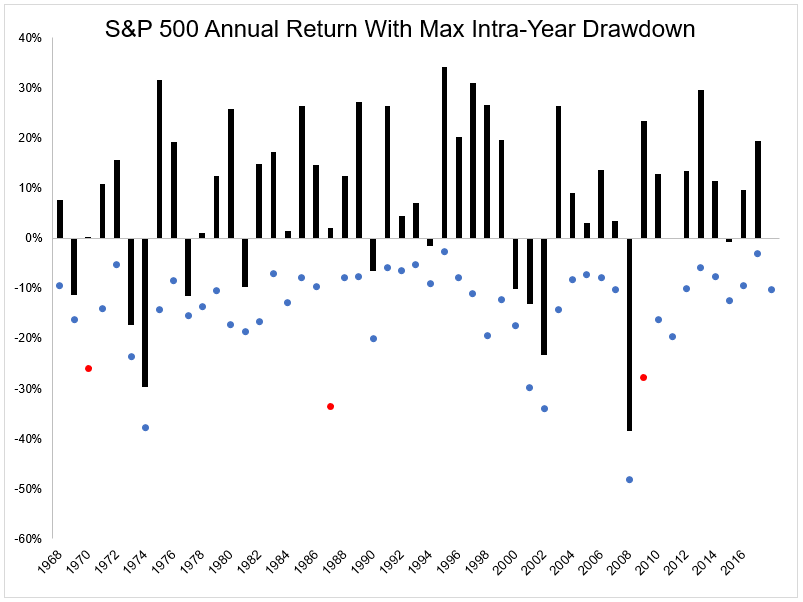
Over the last 50 years, 1970 joins 1987 and 2009 as the only years when the S&P 500 fell 25% from its highs and still finished positive on the year.
This bear market hit hard. The New York Times wrote, “Before yesterday’s slide, calculations put the loss in market value of all listed and un listed securities over the last 18 months at around $280‐ billion. If this sum were split among the nation’s 26 million shareholders, it would work out to a paper loss of more than $10,000 for each person.” From June 1969 through May 1970, small stocks fell twice as much as larger stock, which is one of the reasons that hedge funds were hit particularly hard. Talking about their struggles in a 1970 piece for fortune, Hard times come to the hedge funds Carol Loomis wrote,
The 1969 experience has been a rude awakening for many hedge-fund investors, and has left some of them with strong reservations about the whole concept….. During the month of June, when the market, as measured by the Big Board’s composite average, dropped by 6.9 percent, eight hedge funds on which Hartwell collected data (his own two were included) dropped on the average by 15.3 percent. In July, when the market fell 6.4 percent, the funds were down by an average of 10 percent. And in August, when the market bounced back briefly, the seven funds for which Hartwell had data averaged only a 4.2 percent gain, compared to a 4.5 percent gain for the composite average.
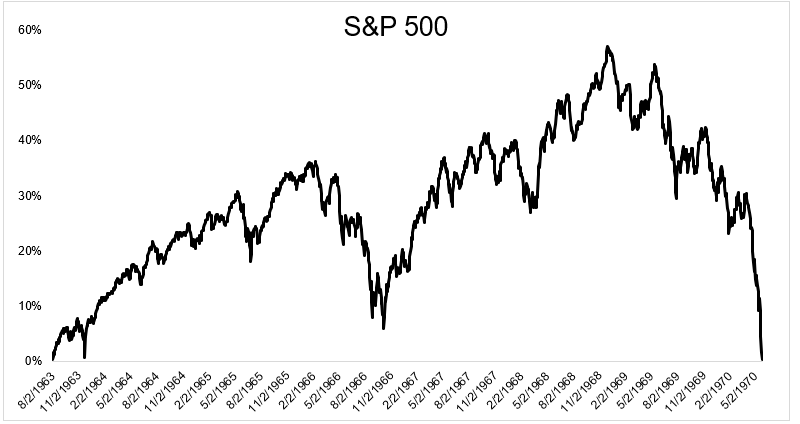
The implosion of the Nifty Fifty stocks wiped out all the gains of the previous seven years.
There are people comparing today’s market with the go-go years. I think these comparisons are misguided for a variety of reasons, which you can read about it here if you’re interested. That being said, it certainly is possible, probable even that at some point over the next few years we will experience a bear market in which part or all of the gains from recent years are wiped out. Now is the time to make sure your portfolio, financial plan and most importantly your ability to withstand it emotionally is in place. The best time to prepare for a storm are when the skies are blue.

