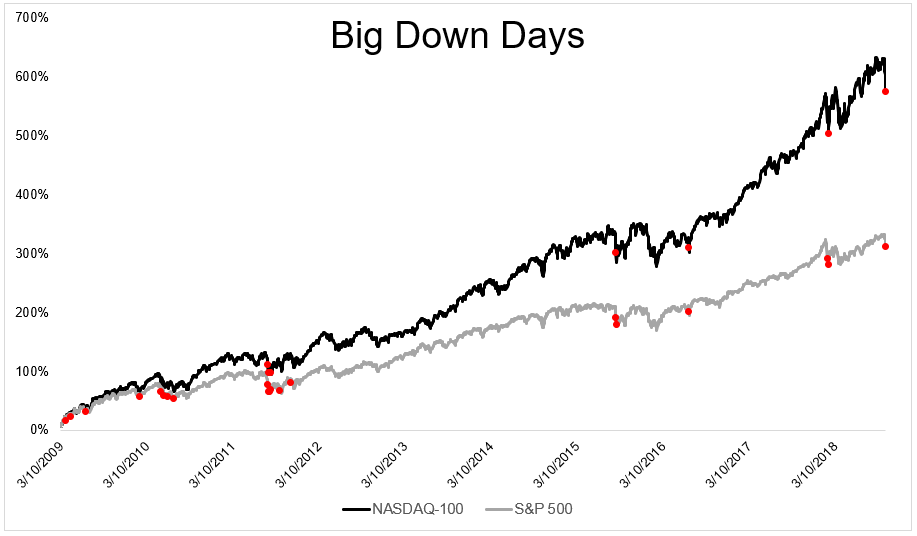
Today was one of those days where we’re reminded what it feels like to lose money. We know this is what we signed up for, but it doesn’t make dealing with them any easier when they happen. All of the red dots in the plot below felt like it was the end of the party. One of them, maybe this one, will in fact be the final hurrah.
The S&P 500 experienced its twentieth -3% day since the bear market ended in 2009. The NASDAQ-100 experienced its eighth -4% day. Today was not fun.
The selling over the last five sessions has been brutal in many cases, with winners and losers alike getting sold.
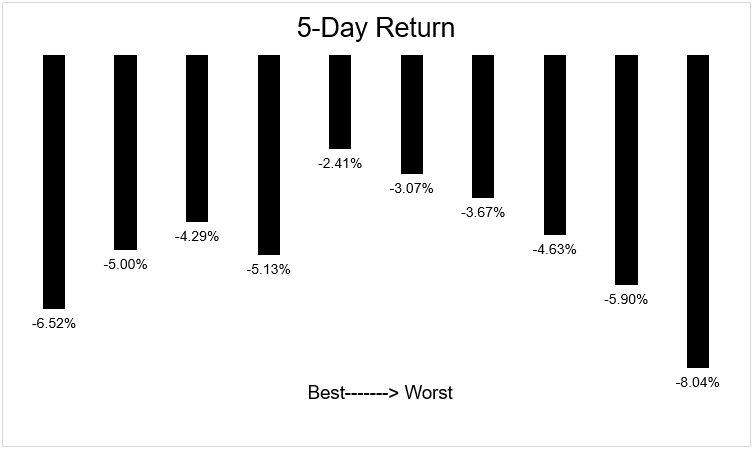
Oddly and probably not at all meaningful, the best performing and worst performing stocks got hit hardest over the last five days. The chart below shows the 5 day returns for stocks broken down into deciles from the best performing S&P 500 stocks YTD on the left to the worst on the right.
Here is the same data in table form.
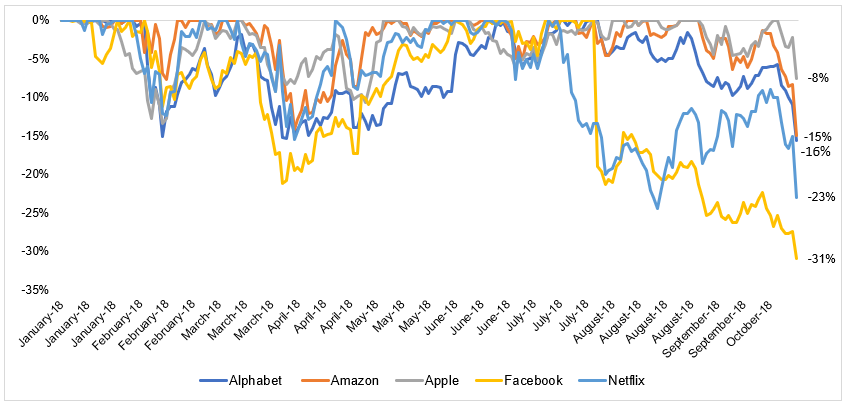
The S&P 500 is now 5.2% off its September highs and the FAANG stocks have participated on the downside. Facebook and Netflix- which is still up 68% YTD- are in a bear market. Google is not far behind.
It might not feel like it, and I know it doesn’t make today feel any less lousy, but the S&P 500 is back where it was in July and is still up 5% (TR) this year. So if you were nervous during today’s sell off, maybe you’re taking too much risk, and if you weren’t nervous maybe you could afford to take a little bit more.
Michael Batnick is a managing partner at Ritholtz Wealth Management. He is the co-host of Animal Spirits, What Are Your Thoughts, and The Compound and Friends. For disclosure information please see here.
Get a Full Investor Curriculum: Join The Book List
Every month you'll receive 3-4 book suggestions--chosen by hand from more than 1,000 books. You'll also receive an extensive curriculum (books, articles, papers, videos) in PDF form right away.
 Oddly and probably not at all meaningful, the best performing and worst performing stocks got hit hardest over the last five days. The chart below shows the 5 day returns for stocks broken down into deciles from the best performing S&P 500 stocks YTD on the left to the worst on the right.