Things were going well for crude oil in 2018. After a few rough years, it was looking to deliver a double digit return, with a 27% gain through early October. The black gold hit nearly $77 a barrel, reaching its highest level in four years. But then, with no warning and without an apology, it swiftly fell 16% from its highs and finished the month with a -11.8% return. Naturally, some investors were caught leaning the wrong way.
Yesterday The Wall Street Journal reported on an “Oil Hedge Fund Giant Hammered in Crude’s Slide.” The $1 billion Andurand Commodities Fund lost 20.9% in October and is now down more than 12% for the year. Down 20% in a month is brutal, but this performance is likely a lot harder on the fund than its investors.
I’m guessing that few, if any investors have the bulk of their portfolio in a strategy like this. No way to substantiate this, but I’m guessing ~10% is the average exposure to commodities for investors that hold the asset class. If you have a 10% position that goes down 20%, it’s a 2% drag on your overall portfolio. That’s a rough month, but hardly catastrophic. Like I said, the -20% decline hurts the fund a lot more than it hurts its investors.
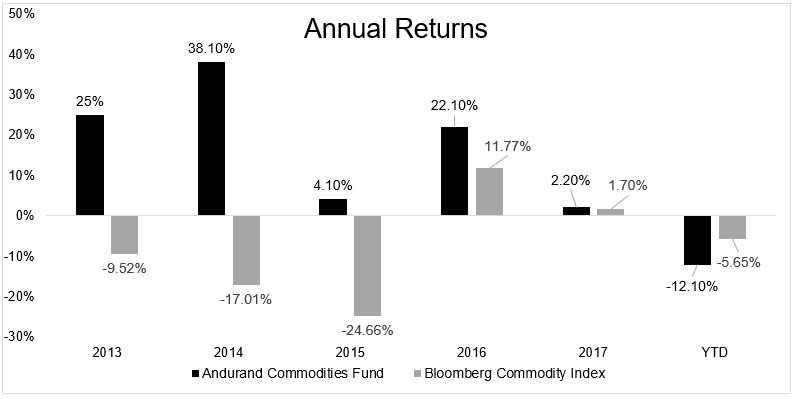
It’s easy to get caught up in large numbers, but context is required. The fund has absolutely crushed the broader commodity index going back to 2013 (numbers in the journal story).
Below shows the fund’s annual returns versus the Bloomberg Commodity Index. If you’ve been invested in this fund for a few months you’re okay, and if you’ve been invested for a few years you’re great.
A fund with a billion dollars losing 20% in one month is definitely a story, but often things get lost in the raw numbers. Whether it’s a single fund or a single asset class, it’s important for readers to keep in mind that you’re only seeing a slice of an investor’s portfolio and not the entire pie.
Michael Batnick is a managing partner at Ritholtz Wealth Management. He is the co-host of Animal Spirits, What Are Your Thoughts, and The Compound and Friends. For disclosure information please see here.
Get a Full Investor Curriculum: Join The Book List
Every month you'll receive 3-4 book suggestions--chosen by hand from more than 1,000 books. You'll also receive an extensive curriculum (books, articles, papers, videos) in PDF form right away.
 A fund with a billion dollars losing 20% in one month is definitely a story, but often things get lost in the raw numbers. Whether it’s a single fund or a single asset class, it’s important for readers to keep in mind that you’re only seeing a slice of an investor’s portfolio and not the entire pie.
