In August 2017 I wrote “This will be my last post on the CAPE ratio.” I made it 16 months, which means I pretty much kept my word.
I was listening to Invest Like the Best when Cliff Asness said, “You do not want to make a career trying to beat the stock market based on whether it is cheap or expensive.” This sent me back to the drawing board.
There are no universal agreements as to what makes something cheap or expensive, but if you’ll indulge me for a minute, I’ll try to quantify this very big statement from Cliff.
You’ll have to bear with me while I make some ridiculous assumptions:
- That the S&P 500 was an investable index (it was the S&P 90 prior to 1957).
- That the CAPE ratio was a thing (Ben Graham did something similar, but at the individual stock level)
- That there are no transaction fees
- That there are no taxes
- That dividends could be reinvested without any costs
- That you get perfect execution pricing at the close of the last day of the month when a signal triggers
- That you had clean earnings data
- That investors actually stick with strategies when they don’t work
Okay, with that out of the way, let’s look at a very simple strategy. You invest in stocks (S&P 500) when they’re below the average CAPE ratio, and you sell them when they’re above. A quick note on this- some analysis assumes that an average from inception until today was available 50 years ago. Needless to say it was not, so for this strategy I’m assuming that the investor only uses the data available at that time.
The chart below shows the growth of $1 if it invested in stocks when they’re below the average CAPE ratio, and sell them when they’re above the average CAPE ratio. The buy/sell occurs on the last day of the month and when stocks are sold, the money goes into 5-year U.S. treasury notes.
From 1926-1955, this strategy had the same returns as buy and hold, 9.9% a year, turning $1 to $4.10.
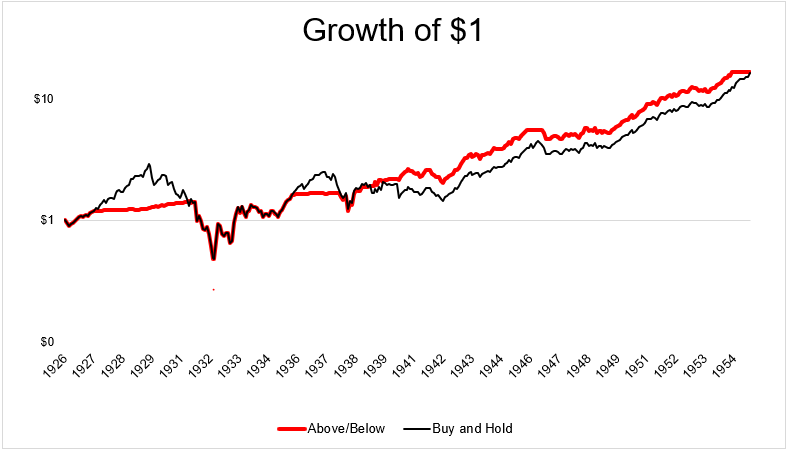
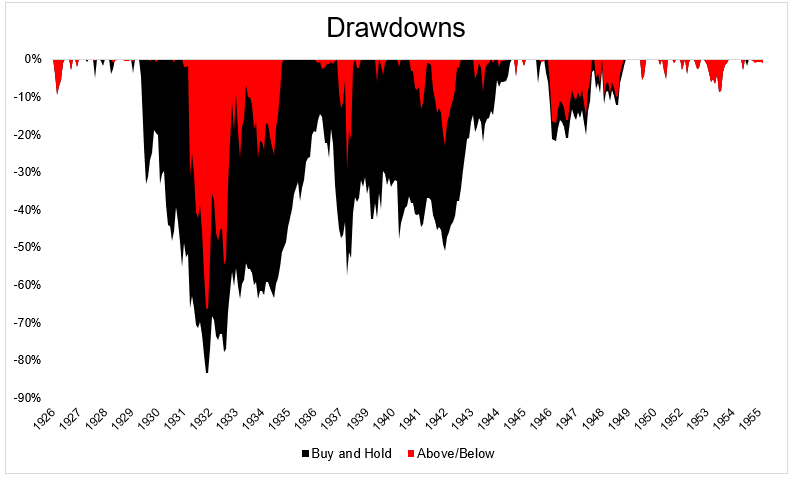
It also experienced less severe drawdowns, although it still got crushed in the Great Depression, like everything else.
But then something changed. The strategy stopped working.
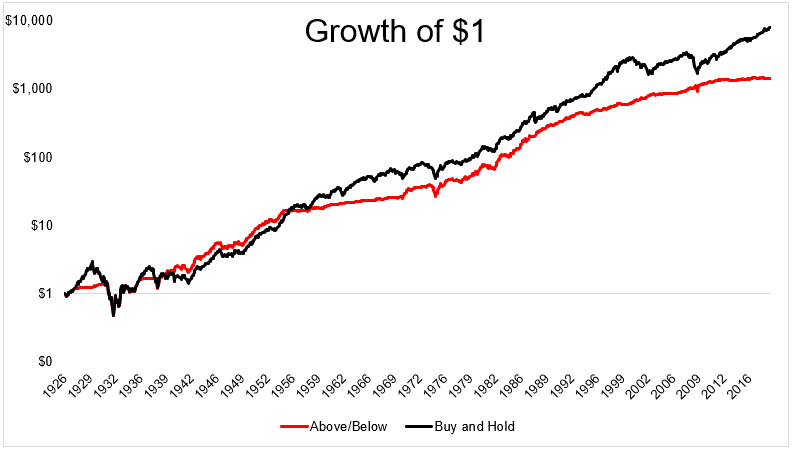
Below are the returns from 1955 to today.
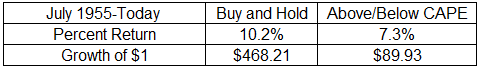
So what happened? Well, maybe this is just a crummy strategy that “worked” for thirty years. Or maybe the nature of the CAPE ratio has changed over time. From 1926-1955, this would have kept you invested in stocks 68% of all months. From 1955-today, this would have been invested just 25% of the time. The chart below shows the average CAPE ratio in real time (black) versus the CAPE ratio going all the way back to the beginning of the data series.
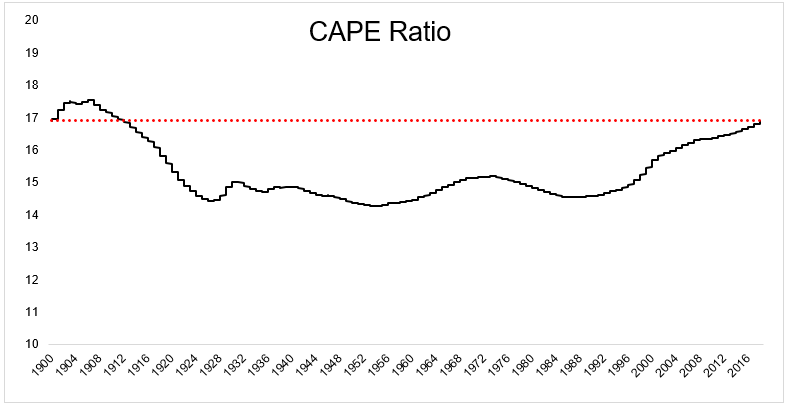
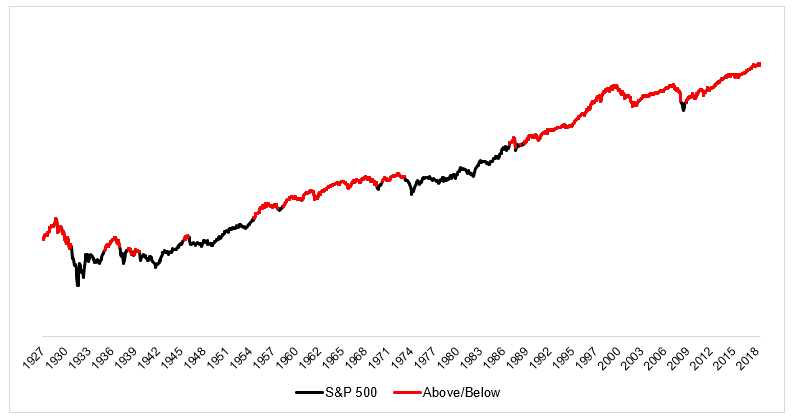
The average CAPE bottomed in 1955, and has been on the rise for the last 30 years. Which explains a lot of why this strategy would have done horribly in the last few decades. The chart below shows the S&P 500 (black), and when this strategy would have been in bonds (red). As you can see, from 1990 to today, the CAPE ratio was above its average 98% of the time.
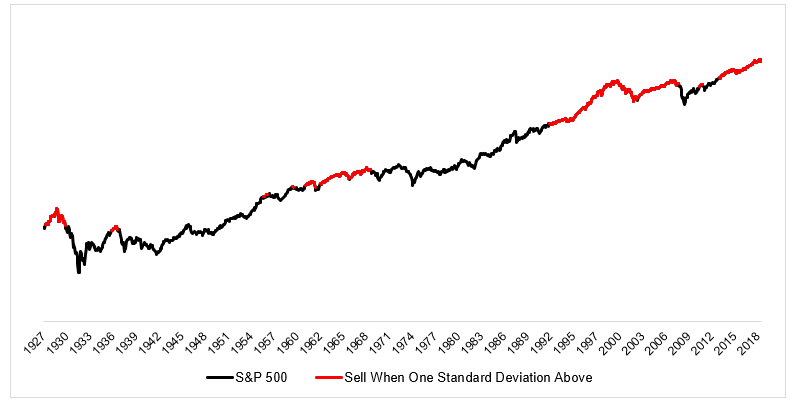
So, Cliff was right when he said “You do not want to make a career trying to beat the stock market based on whether it is cheap or expensive.” But what if there was a better way to define expensive? For this next backtest, I assumed you were invested in the S&P 500 and only rotated into bonds when stocks closed one standard deviation above their average (also real time, trade on last day of the month).
The chart below shocks the CAPE ratio in black, the average across time in gray, and 1 standard deviation above the average in red.

Interestingly, this strategy kept pace with buy and hold from 1926 all the way to 2013.
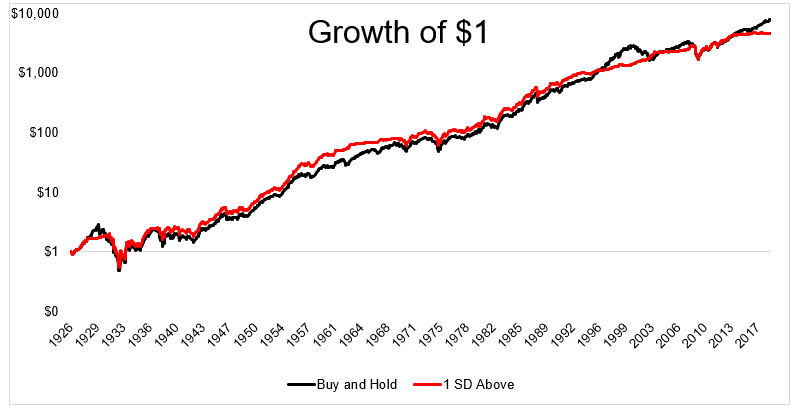
But it would have you in bonds for the last 63 months, missing out on an 82% gain for the S&P 500.
Which gets us back to what I think Cliff was trying to say. The more you pay for an investment, the less you should expect to receive, on average. But the idea that you can use valuations as a way to time the market is probably not going to work for most people most of the time.

