The bear market of 1969 absolutely wrecked small stocks.

In just 17 months, they lost 56% of their value, leaving investors once bitten, twice shy. People saw how quickly smaller companies could lose their value, so they turned to a new group of “one decision” stocks. These were blue-chips that had such high growth prospects that no price was too high to pay. This group became colloquially known as “The Nifty Fifty”.
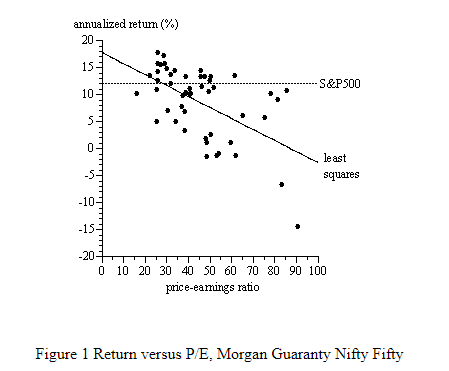
So who were the Nifty Fifty? Turns out there never was an official stamp on this group. There was a list from Morgan Guaranty Trust (that was found in the footnote of a 1977 Forbes article) and a list from Kidder Peabody that showed the 50 Big Board stocks with the highest P/E ratios.
There were 24 stocks that appeared on both lists, which you can see in the table below. The first column shows their P/E ratios in 1972, and their annualized return for the next few decades in the second column.

This table comes from a 2001 paper , The Nifty-Fifty Re-Revisited, where the authors looked at how this group did over the next several decades compared to the S&P 500. Many of these high-fliers would underperform the market for the next 3 decades.
The authors wrote:
Only ten stocks on the Kidder Peabody list beat the S&P 500, but one did so spectacularly. Wal-Mart’s 26.96% annualized return over this 29-year period was the third highest in the entire CRSP data base. Perhaps, buying a high P/E stock is like buying a lottery ticket: the expected return is not good, but there is a chance of a huge payoff. Here, 80 percent of the Kidder Peabody stocks underperformed the market, but one (yes, one with a P/E above 50) hit the jackpot…The Terrific 24 stocks that were on both lists did substantially worse than the S&P 500. An investor who bought these 24 stocks at the end of 1972 would have had 50 percent less wealth at the end of 2001 than an investor who bought the S&P 500.
Which brings us to today. There have been plenty of comparisons over the years between this market and the one from the early 70s, and the main reason cited is the fact that these names are over loved, over owned, and are trading at an above average price-to-earnings multiple. But looking at a P/E ratio often misses the bigger picture.
The price-to-earnings ratio doesn’t tell you how fast the business is growing, what their capital structure looks like, or how much cash they have. It would be like looking at how many passing yards a quarterback has through 10 weeks and deciding if you want to bet on that team to make the playoffs. That gives you some information, but not everything you would need to know to make an informed decision. But be that as it may, let’s take a look at the trailing 12 month P/E ratios for the FAANG stocks (data from Ycharts)
Apple- 14.5
Facebook -20.5
Google- 39.6
Amazon- 87.6
Netflix- 94.3
So there you have it. Netflix is the new Polaroid and Amazon is the New Disney. Wait a minute, do these comparisons actually make sense?
Isn’t it fair to say that these five names have been the best businesses and that the market is rewarding them with a growing share price and in some cases, higher multiples? Yes that seems reasonable. But isn’t it also fair to say that price matters? Yes, that also seems reasonable.
Is there any amount of realistic growth which can justify the fact that earlier in the year, over the course of a few months, Amazon added more in market cap than the combined worth of Target, Home Depot and Costco? No, I don’t think so.
It’s uncomfortable to have contradictory thoughts, which is why it’s easy to say things like “This reminds me of The Nifty Fifty.” Comparisons are a lot cleaner than nuance.
There will never be a market that isn’t compared to another. It’s how we help make sense of the world. How we fool ourselves into thinking that we’ve seen this movie before and therefore we know how this one ends. But of course we don’t know. How could we?
Knowing your history doesn’t make the future any more clear. Maybe this plays out for Amazon like it did for Xerox, or maybe we’re just comparing apples to oranges.

