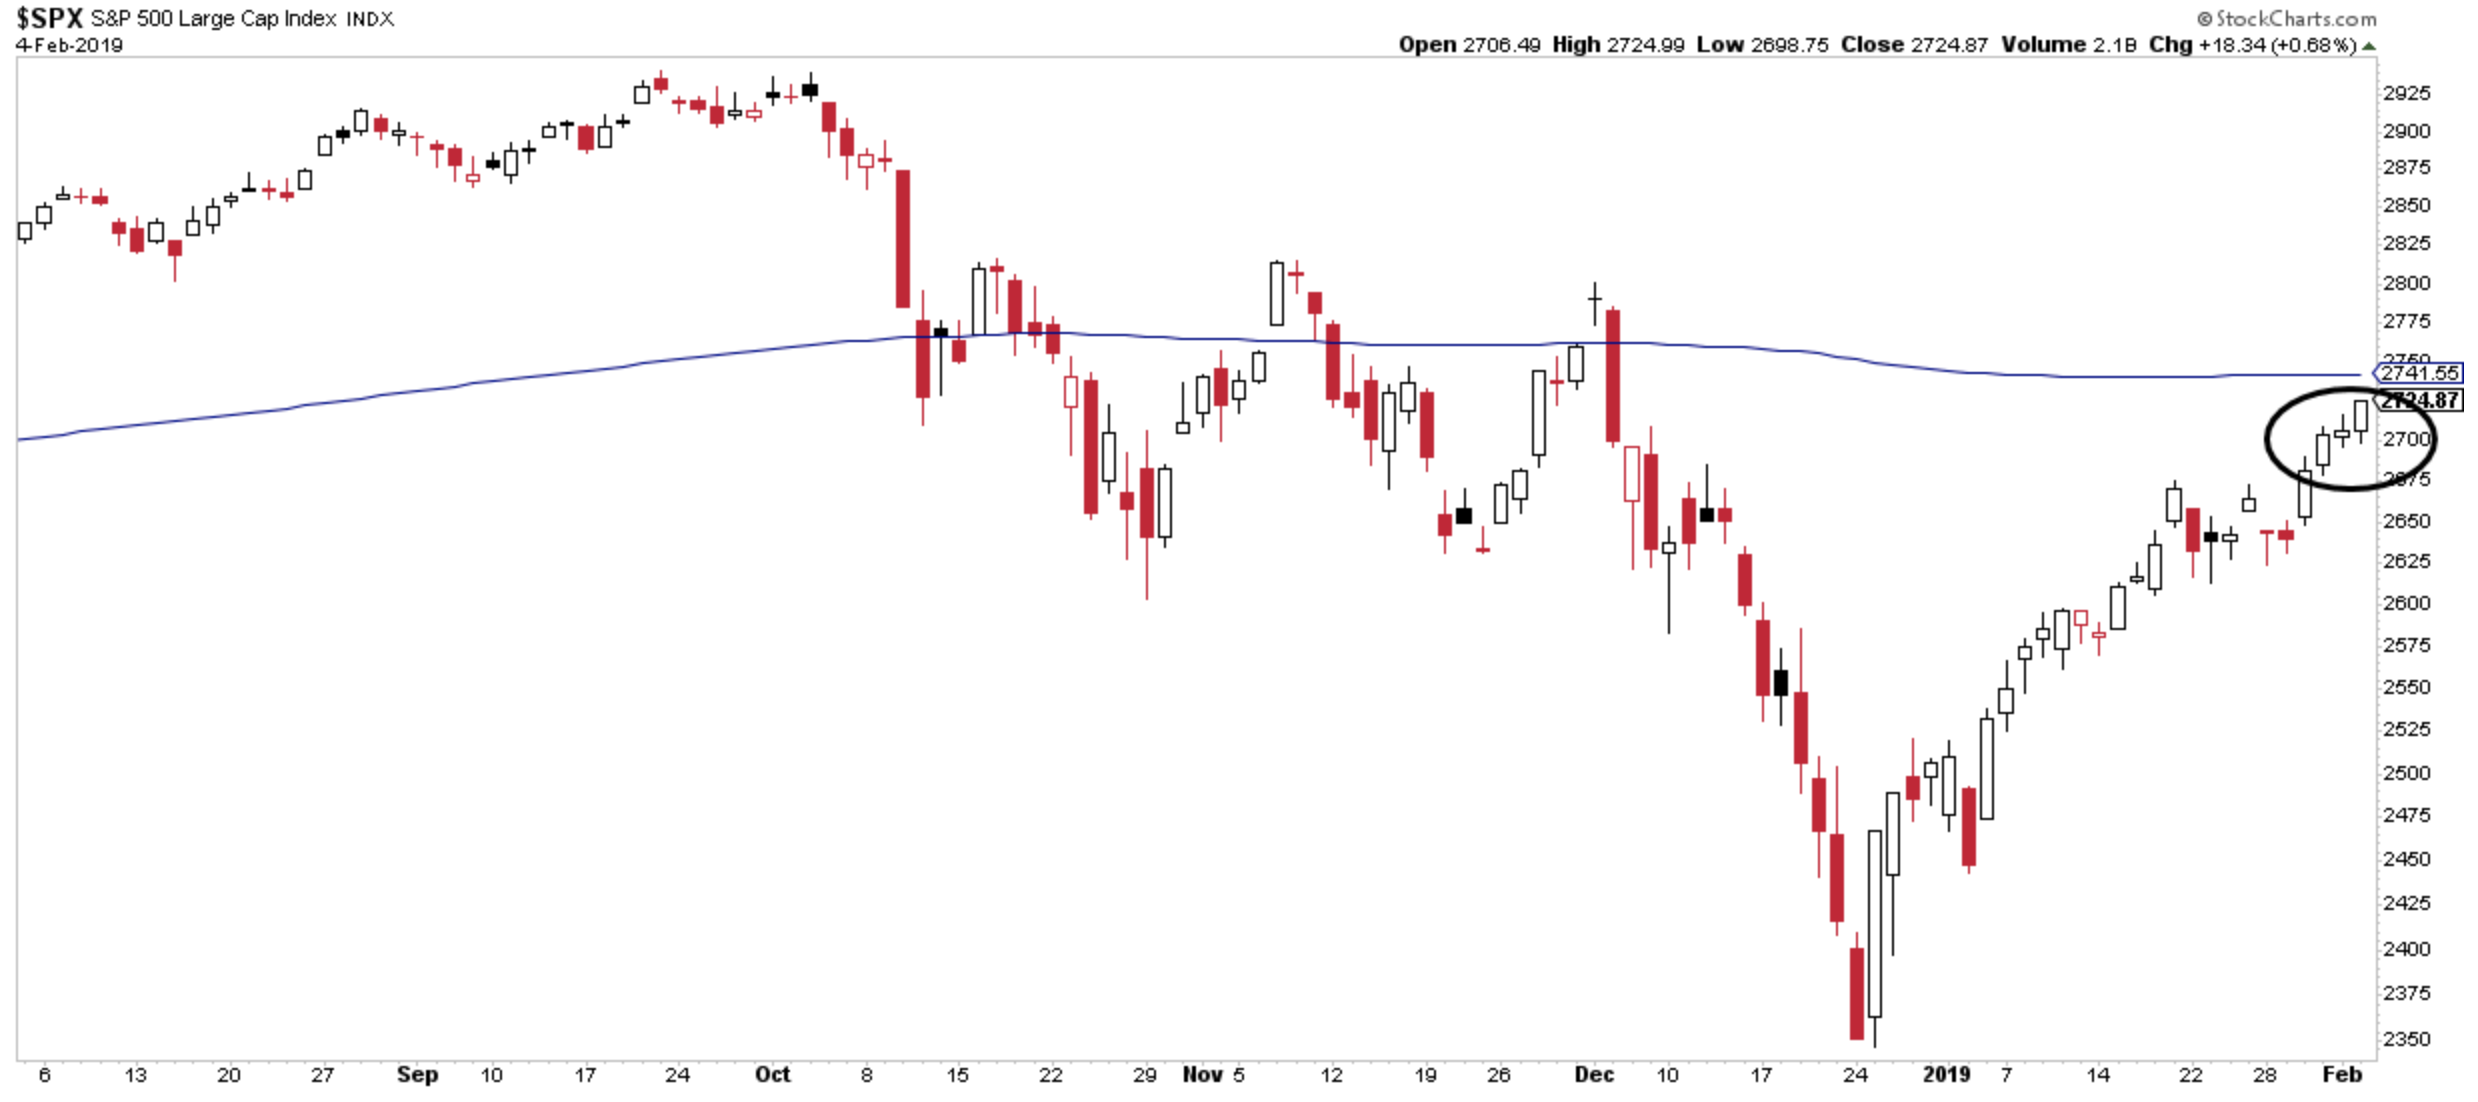
What a comeback. The move over the past few weeks has the bulls saying “We’re still here” (I’m sorry)
The fourth quarter decline was so steep, however, that despite the bounce, the S&P 500 is still below its 200-day moving average.
What just happened is a fairly rare occurrence, so I put on my data mining hat to see if history could give us a clue as to what might happen next.
I looked at the previous instances where the S&P 500 gained 15% over 27 sessions and was still trading below the 200 day moving average.
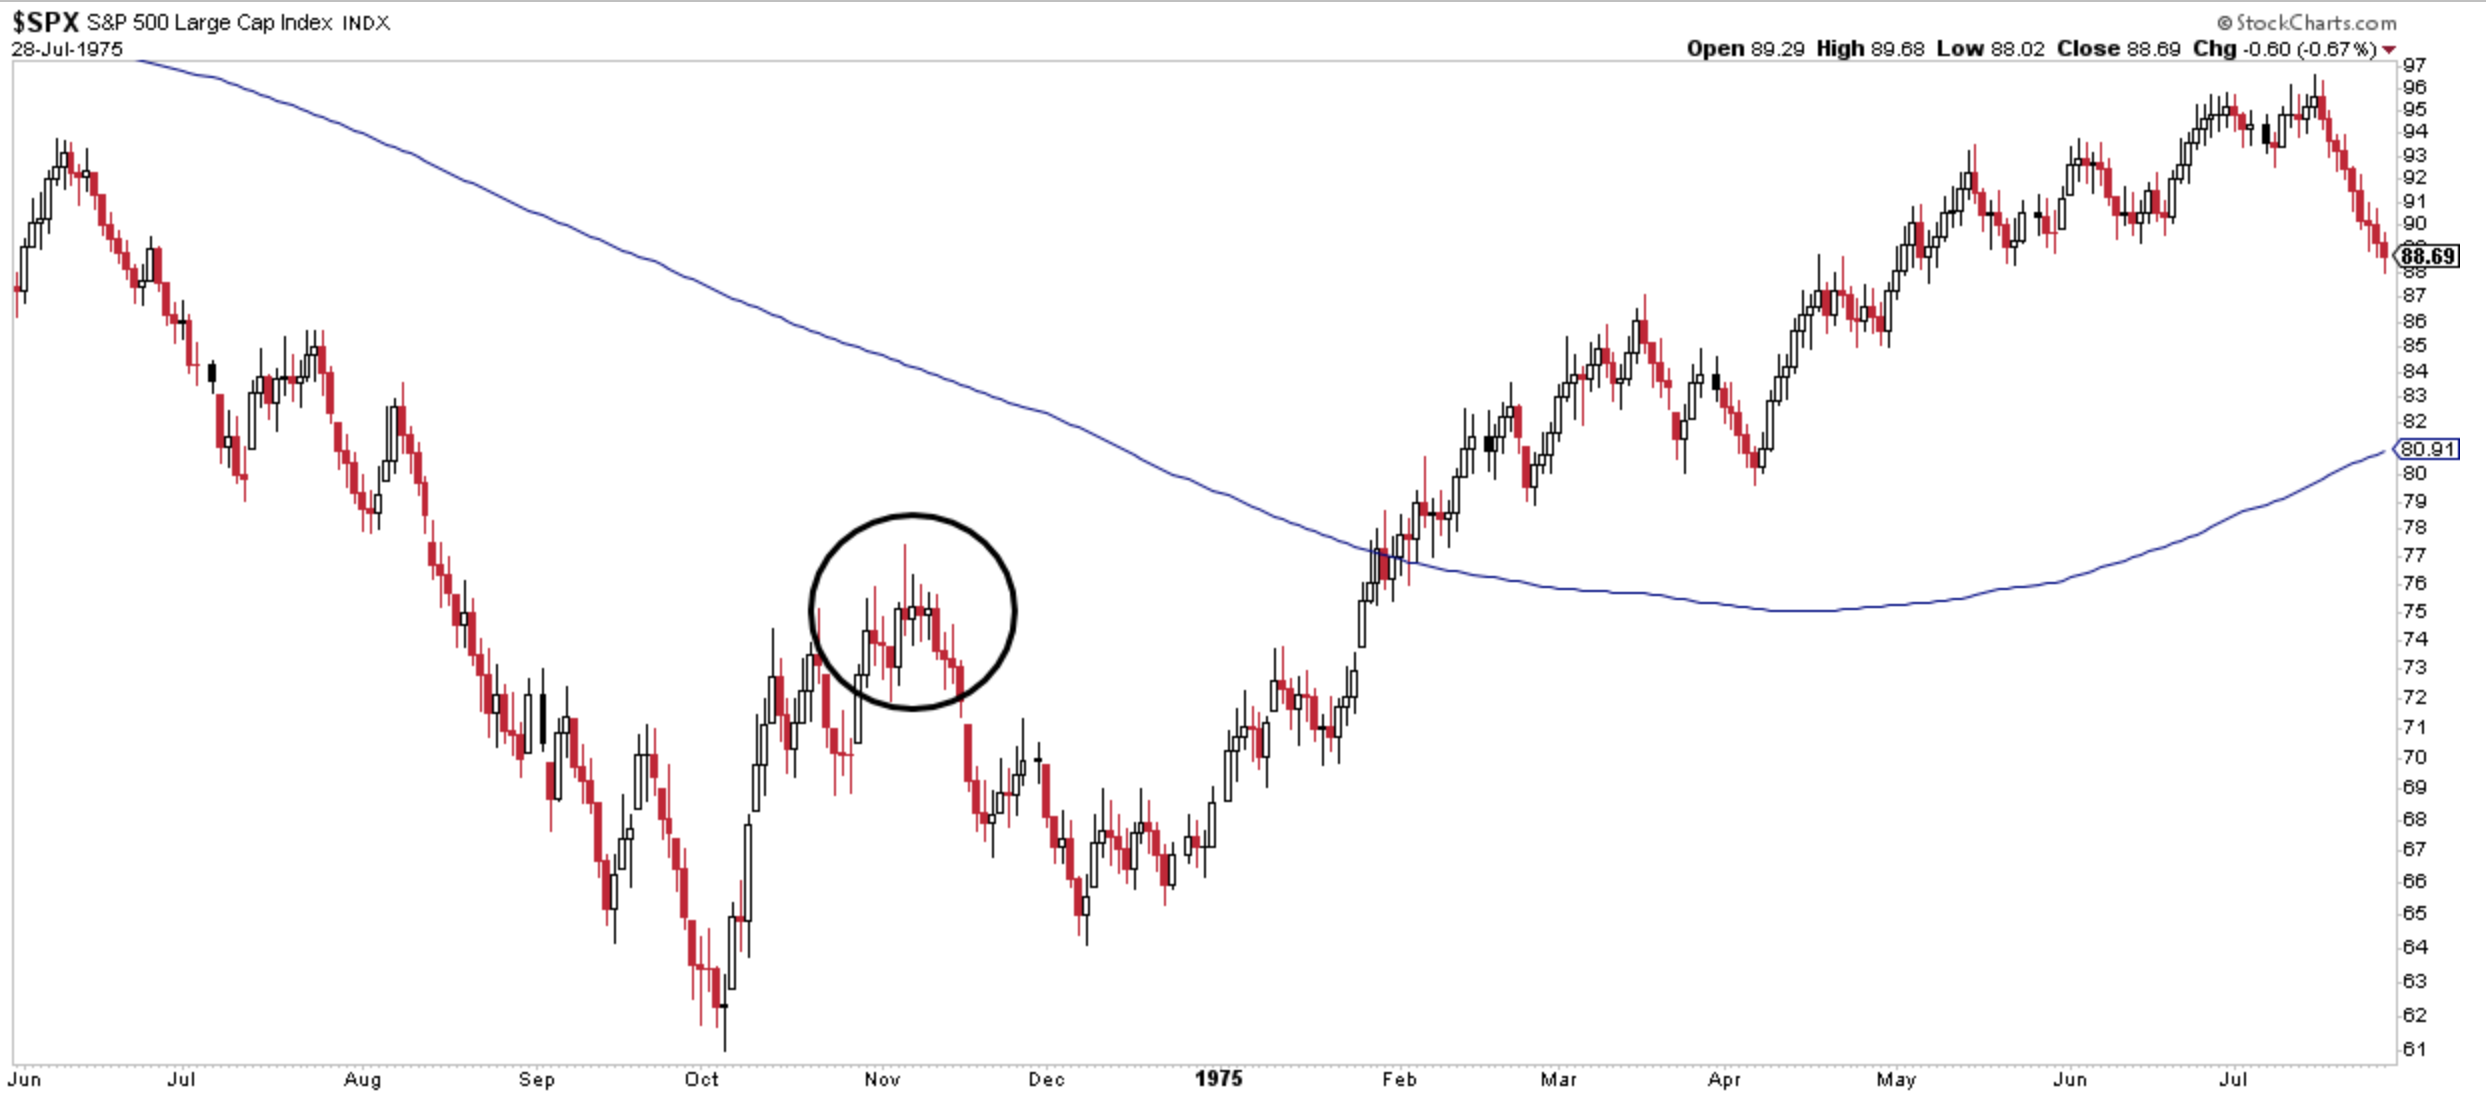
This happened in November 1974 which was close to the ultimate bottom, but this bounce marked a short-term top. As you can see in the chart below, there was still one final 17% shakeout before the selling ended in December.
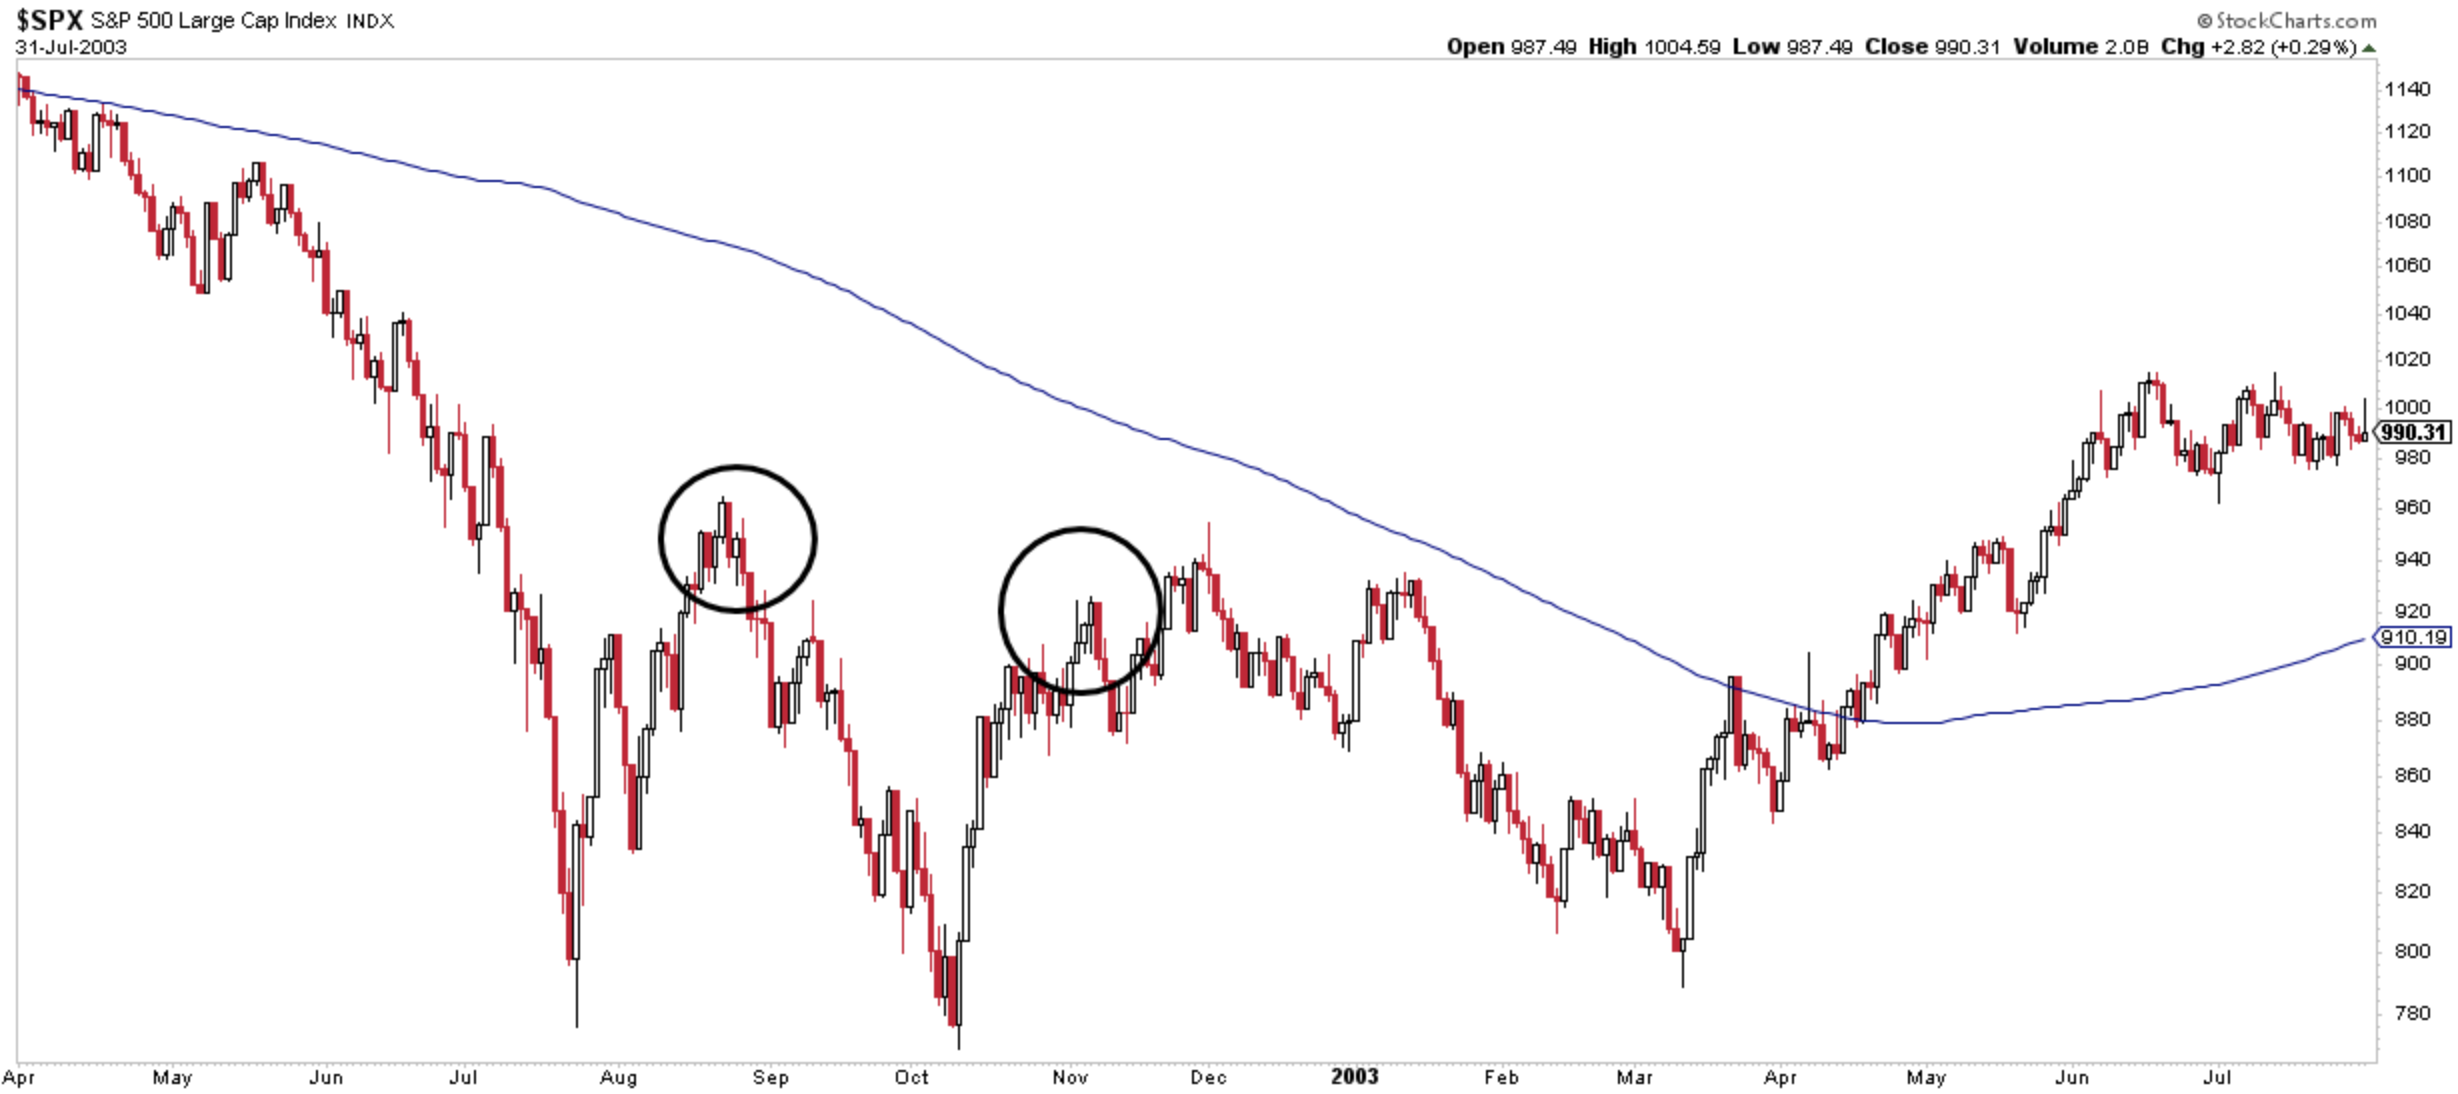
This next occurred in August 2002. Again, this was close to the bottom, but it wasn’t the bottom. Stocks fell 20% over the next few weeks. This pattern repeated itself just a few weeks later, which once again was followed by another final selloff before the bottom in March.
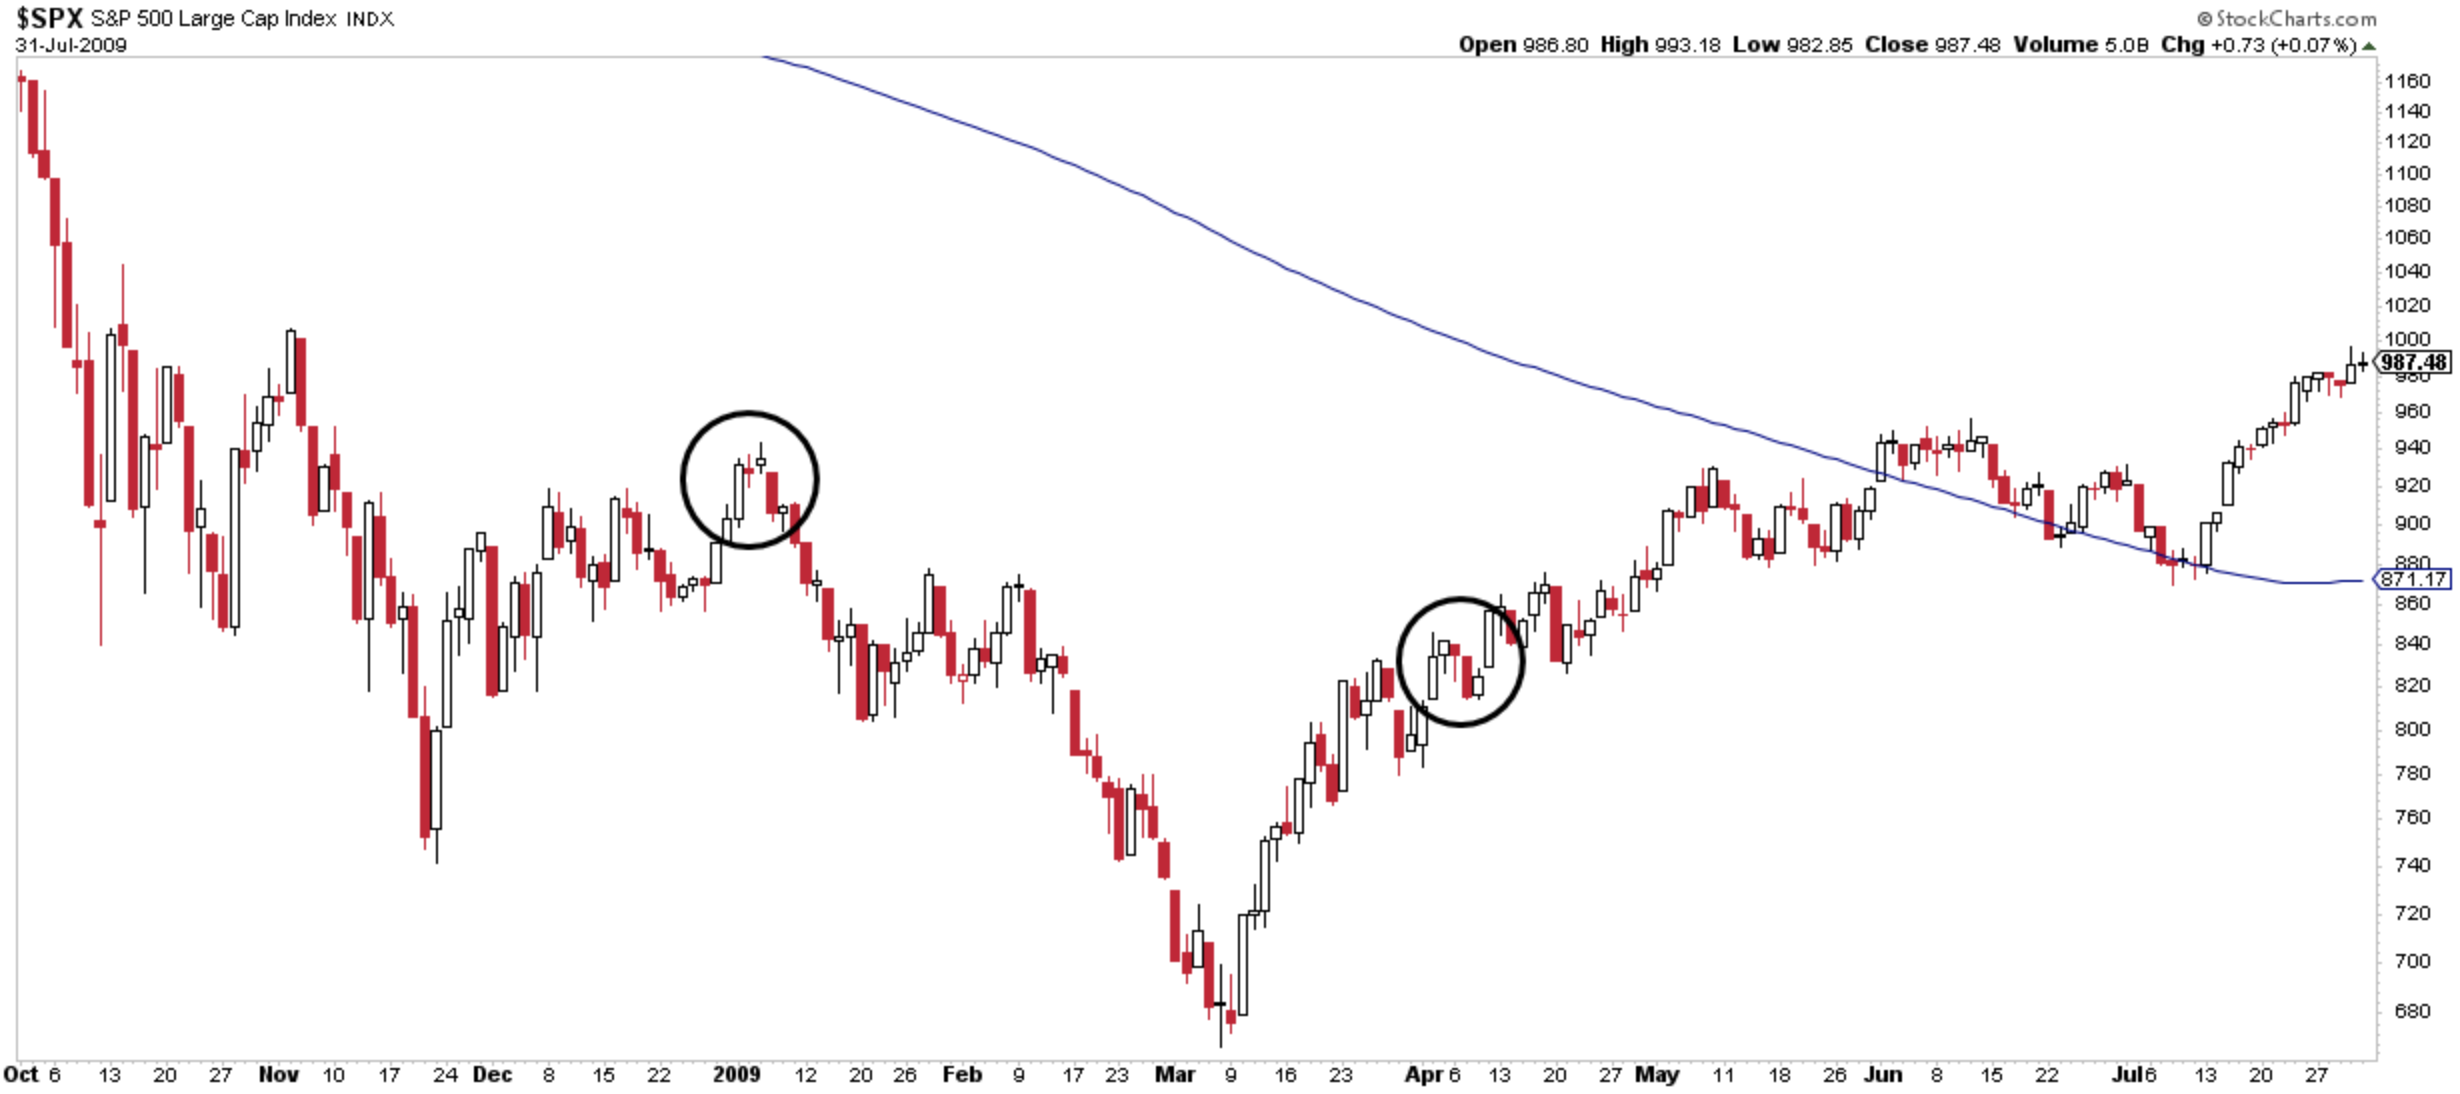
This next happened in December 2008 which was definitely not the bottom. And finally, the last time we saw this was in April 2009 which, in hindsight, was a great time to be buying stocks.
Four out of the last five times stocks experienced this type of bounce, they were of the dead cat variety. That does not, however, mean there is an 80% chance this one fails.
When it comes to the stock market, history doesn’t repeat, and most of the time it doesn’t rhyme either.
Michael Batnick is a managing partner at Ritholtz Wealth Management. He is the co-host of Animal Spirits, What Are Your Thoughts, and The Compound and Friends. For disclosure information please see here.
Get a Full Investor Curriculum: Join The Book List
Every month you'll receive 3-4 book suggestions--chosen by hand from more than 1,000 books. You'll also receive an extensive curriculum (books, articles, papers, videos) in PDF form right away.