One of the more unsettling realities of investing is that we cannot rely on data from the past to guide us in the future.
It’s important that investors learn about market history and have a basic understanding of math, but beyond that, less might actually be more. In Enough, Jack Bogle wrote:
Numbers are not reality. At best, they are a pale reflection of reality. At worst, they’re a gross distortion of the truths we seek to measure.
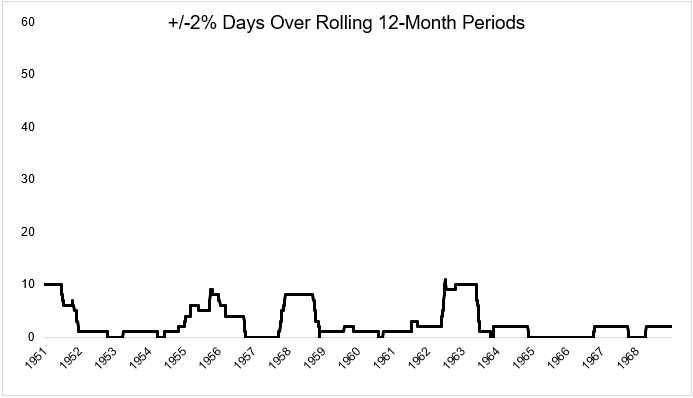
In the 19 years from 1950 to 1968, the stock market took investors on a mostly serene walk down Wall Street. There were peaks and valleys, but there weren’t many fireworks. Just 1% of all days experienced a gain or decline of greater than 2%. Most days, stocks didn’t do very much at all. The median absolute daily change from 1950 to 1968 was just 0.05%.
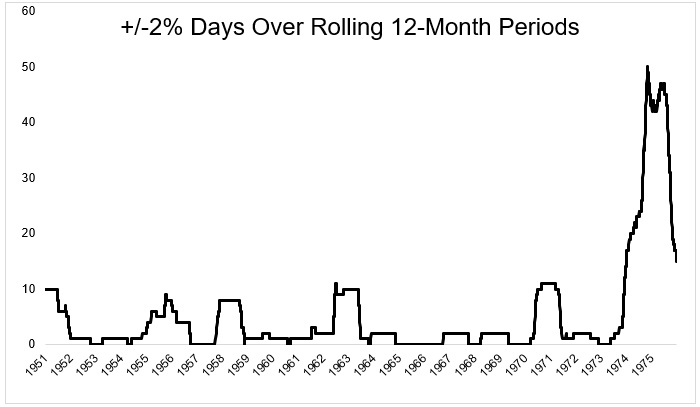
Over this time, the number of 2% up or down days over rolling annual periods never got higher than 11, as you can see in the chart below.
If you were a 35-year old investor in 1950, by the time you were 54 you experienced nothing deeper than a 27% decline. Based on your experience, it would have been reasonable to conclude that stocks are a moderately risky way to grow your money. There was no reason to anticipate what was about to happen next.
In only six months, the stock market lost a third of its value. It recovered in a few years and just as the coast appeared to be clear, boom, the market crashed 45% and the economy experienced the worst period since the Great Depression.
The now 61-year old investor would have just experienced something unthinkable. Something she hadn’t seen in her lifetime. In the 12 months from November 1973 to November 1974, the market had a 2% move 54 times, defying recent history.
Of course few investors in 1974 had the ability to manipulate daily market data in a spreadsheet. Today however, market participants have the tools to perform quantum physics on an second-by-second basis. The availability of granular data has lead some naive horses to toxic water.
“What happens in the following week on average when the VIX finishes positive but is below 20 when the S&P 500 finished down more than 1% while above its 200-day moving average while gold gains 2% and oil falls 2% during the third week of a leap year?
The reason we see ridiculous stats like this all the time is because there is a huge audience for it. OddStats built a big following with this kind of data. I’m pretty sure half of his followers are in on the joke, but the other half probably are unaware. The reason certain people eat this up is because it provides the illusion that we live in a world where the future will resemble the past.
Please don’t misunderstand what I’m saying, base rates are important. But but be careful relying too heavily on statistics because as Jack Bogle wrote “The laws of probability don’t apply to our financial markets.”
It’s helpful to be aware of your surroundings, but in the market you could go from Antarctica to the Amazon overnight and no amount of data can tell you this ahead of time.
If you want to read more, Ben wrote a better version of this last week.

