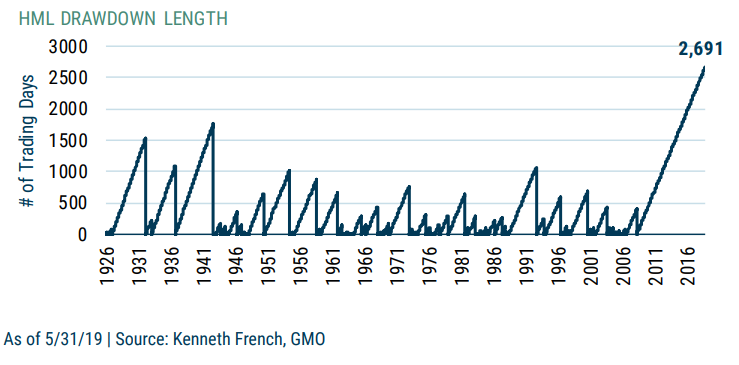
The current environment has been a challenging one for value investors. The bottom decile of value stocks, whether you’re looking at EV/EBITDA, P/FCF, P/E or whatever, have produced returns that badly lagged the overall market. The chart below shows that value, defined here by book-to-market, is in its longest drawdown ever, by far.
I know you’re probably tired of reading the same things over and over, but I think this piece from GMO, Risk and Premium: A Tale of Value is worth taking the time. GMO is in the camp that it’s not different this time, as they explain below.
Many explanations have been given for the disheartening performance of value in the post-GFC world. Some researchers contend that value previously earned above-average returns because investors extrapolated poor fundamental growth too far into the future, and that said behavioral bias has now come undone. Others believe that the commoditization of “smart beta” has led to factor crowding, and that this has eroded the value premium. A third camp believes that something more fundamental, such as increased concentration, has made growth companies inherently more competitive and put value companies at a structural disadvantage. And then there are those who think that nothing has truly changed, that the value premium is alive and well, and that in time the humble shall be exalted.
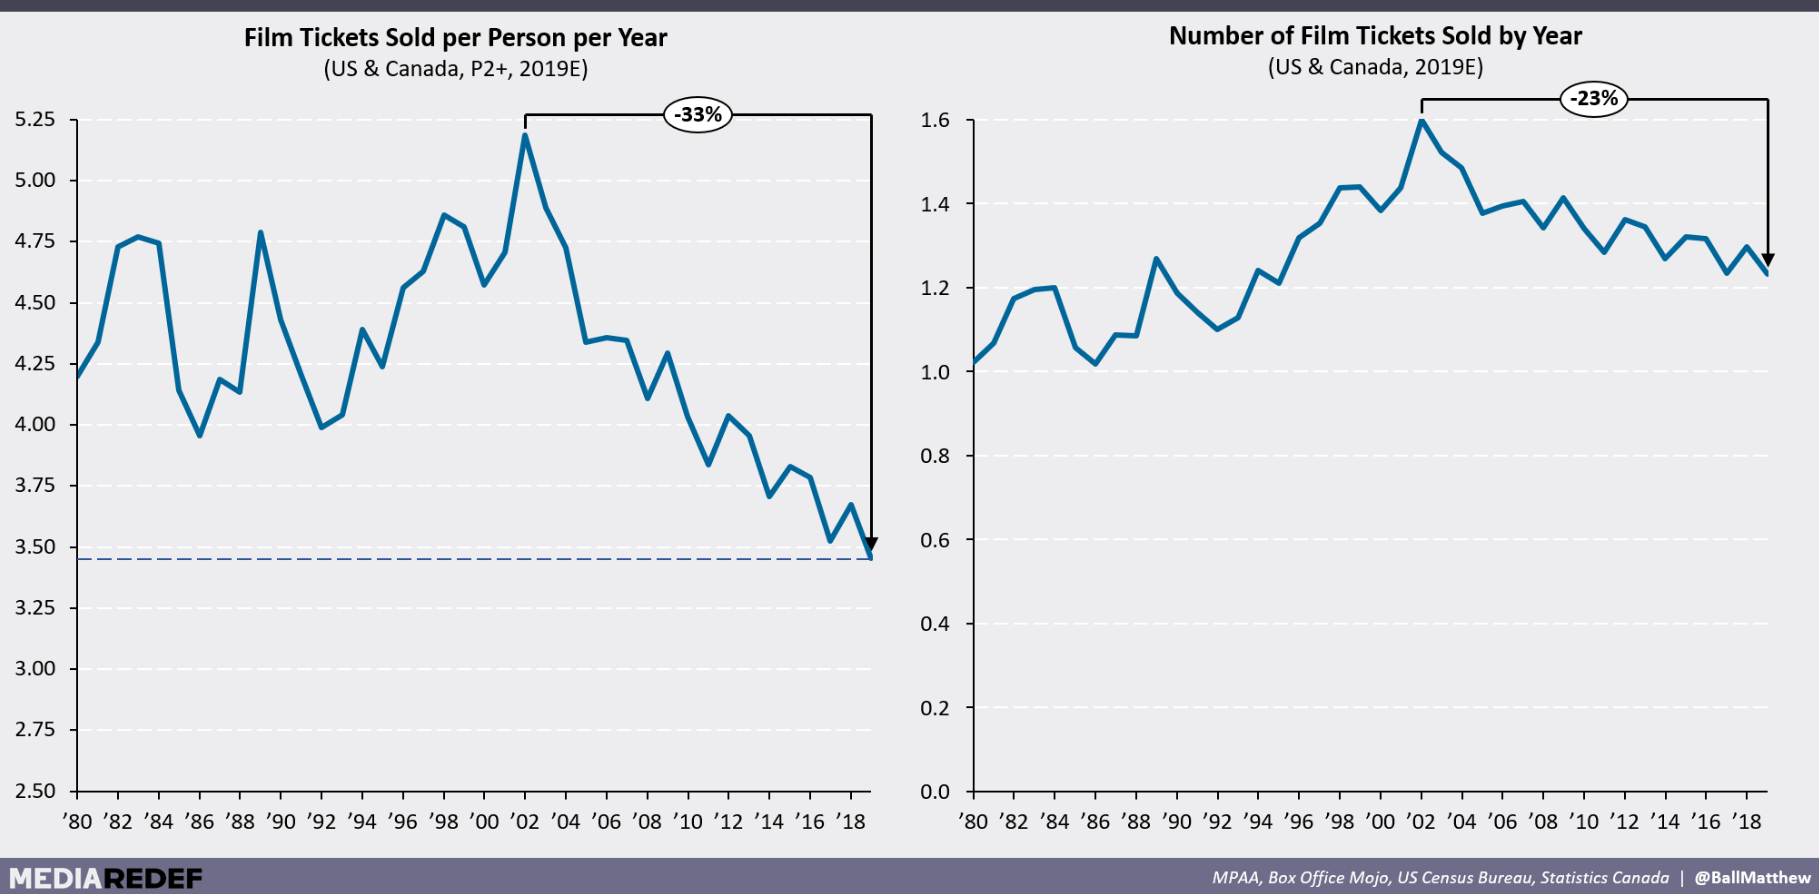
Value stocks aren’t the only thing in a drawdown. Check out this gnarly chart of movie ticket sales. According to this article The Absurdities of ‘Franchise Fatigue’ & ‘Sequelitis’ (Or, What Is Happening to the Box Office?!), “Not for 50 years has a decline in theatrical consumption lasted so long or been so severe. And not since the advent of the theater itself in the 1800s have per capita sales been so low.”
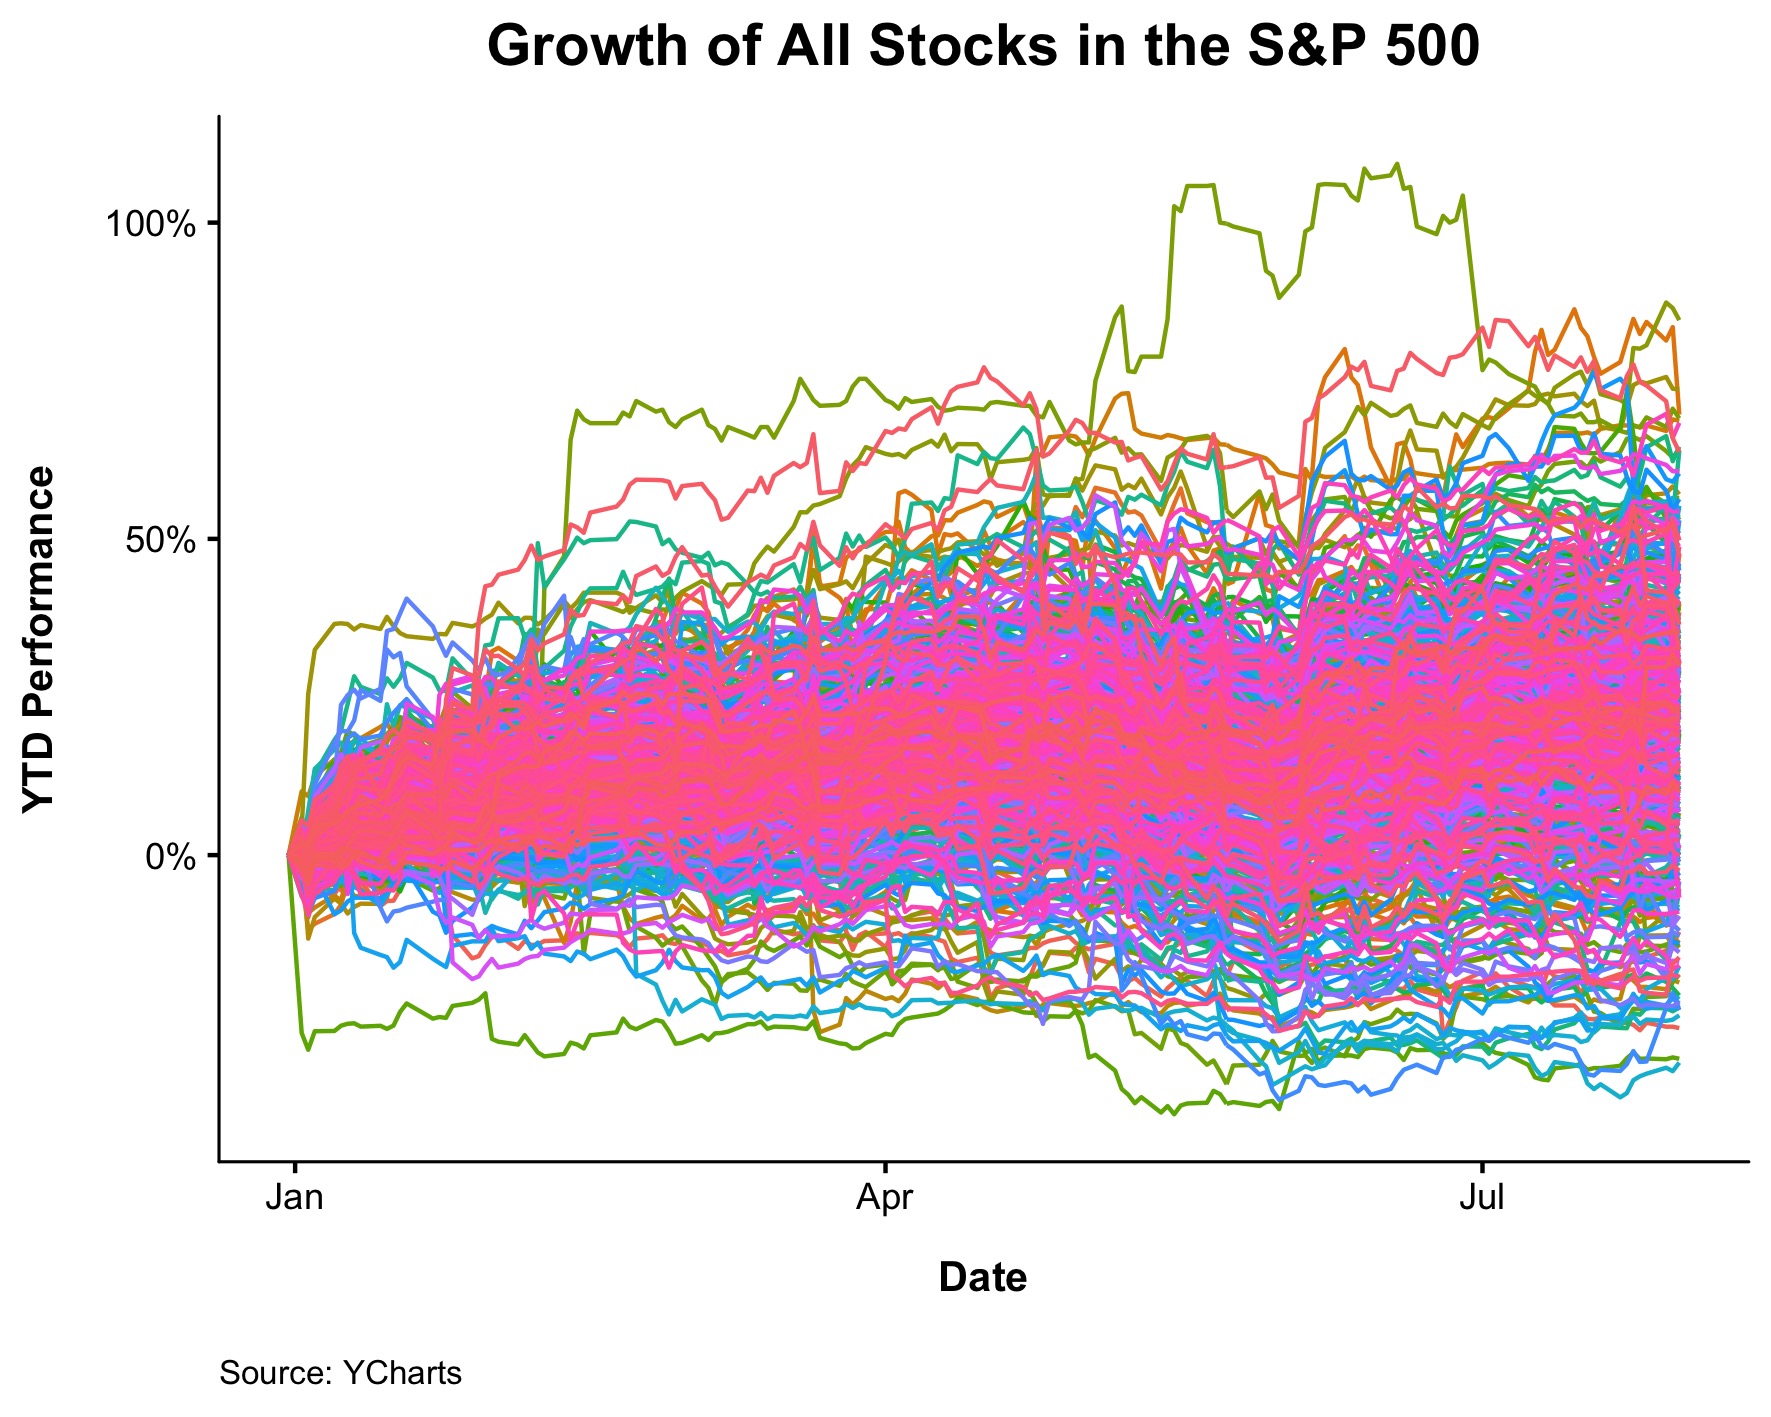
Nick Maggiulli created this beautiful eye sore of a chart.
Needless to say, it’s been a good year for stonks. The S&P 500 is up 20% (21% including dividends). 39 companies are up between 40 and 50%, and another 28 are up more than 50%. There is a lot of dispersion at the top, but a consistent theme on the bottom. Nordstrom, Gap, and Macy’s are all down more then 20% in 2019.
Michael Batnick is a managing partner at Ritholtz Wealth Management. He is the co-host of Animal Spirits, What Are Your Thoughts, and The Compound and Friends. For disclosure information please see here.
Get a Full Investor Curriculum: Join The Book List
Every month you'll receive 3-4 book suggestions--chosen by hand from more than 1,000 books. You'll also receive an extensive curriculum (books, articles, papers, videos) in PDF form right away.