The majority of stocks have lifetime returns that are less than that of one-month treasuries. The best performing 4% of stocks were responsible for all of the wealth created in the stock market from 1926 through 2018.
This information comes from Hendrik Bessembinder’s Do Stocks Outperform Treasury Bills?
A lot of people use this information, rightly so in my opinion, as the case to hold cap-weighted indexes. But there’s another side to this. One potential implication of this data that isn’t often discussed is that if you’re going to deviate from a cap weighted index, a more reasonable focus of one’s time should be avoiding the losers rather than picking the winners. While the big winners are few and far between, there are so many losers that should be avoided.
The chart below shows the percentage of Russell 1000 stocks that have a negative return every year and the magnitude by which their stocks decline.

![]()
In order to put some meat on the bones, I had my friends at O’Shaughnessy Asset Management do some number crunching for me. They showed what would happen if you held a portfolio of global stocks, equally weighted. If you exclude the top 10% of performers the portfolio would have had negative returns and had it missed the top 25% of performers it would have lost 9% a year.

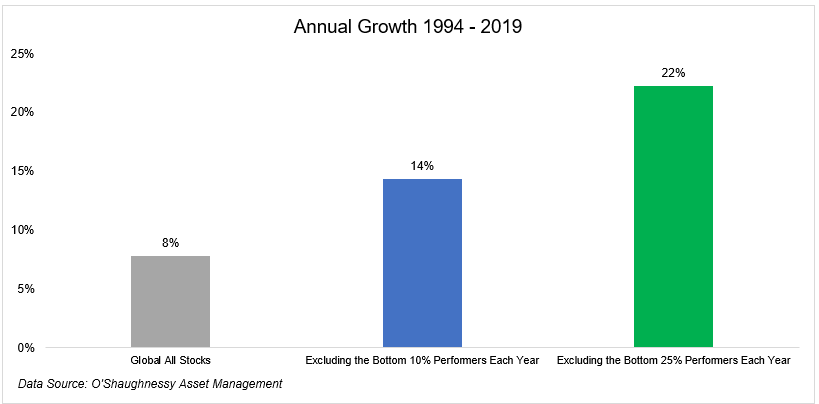
This makes an important point about how critical it is to make sure you have exposure to the biggest winners but there’s something missing here. Since we know that losers outnumber the winners, what would this chart look like if you excluded the crummy stocks?
An equal-weighted portfolio of global stocks that excluded the bottom decile of performers returned 14% a year and a portfolio that excluded the bottom 25% of performers returned 22% a year!
How do you build a portfolio that excludes the biggest losers while simultaneously getting access to the biggest winners? Obviously this is impossible but I think something can be done to work towards something like this. While the characteristics of losing stocks might not be identical every year, I would imagine they share some characteristics over time: Slowing earnings growth, growing accruals, and stock issuance for example. (Again, to be very clear, these portfolios are not real. They’re a result of look-ahead bias and cannot be replicated)
The main reason why cap-weighted indexes work are because capitalism is the 80/20 rule on steroids. Consider that, as Bessembinder shows, just 14 stocks are responsible for 20% of all wealth ever created in the stock market. (Exxon Mobil, Apple, Microsoft, General Electric, IBM, Altria, Johnson & Johnson, General Motors, Chevron, WalMart, Alphabet, Berkshire Hathaway, Proctor & Gamble)
So we know that the few are responsible for the many. But what if there was a way to exclude the many and still include the few? I believe this is a form of active management that is worth pursuing.

