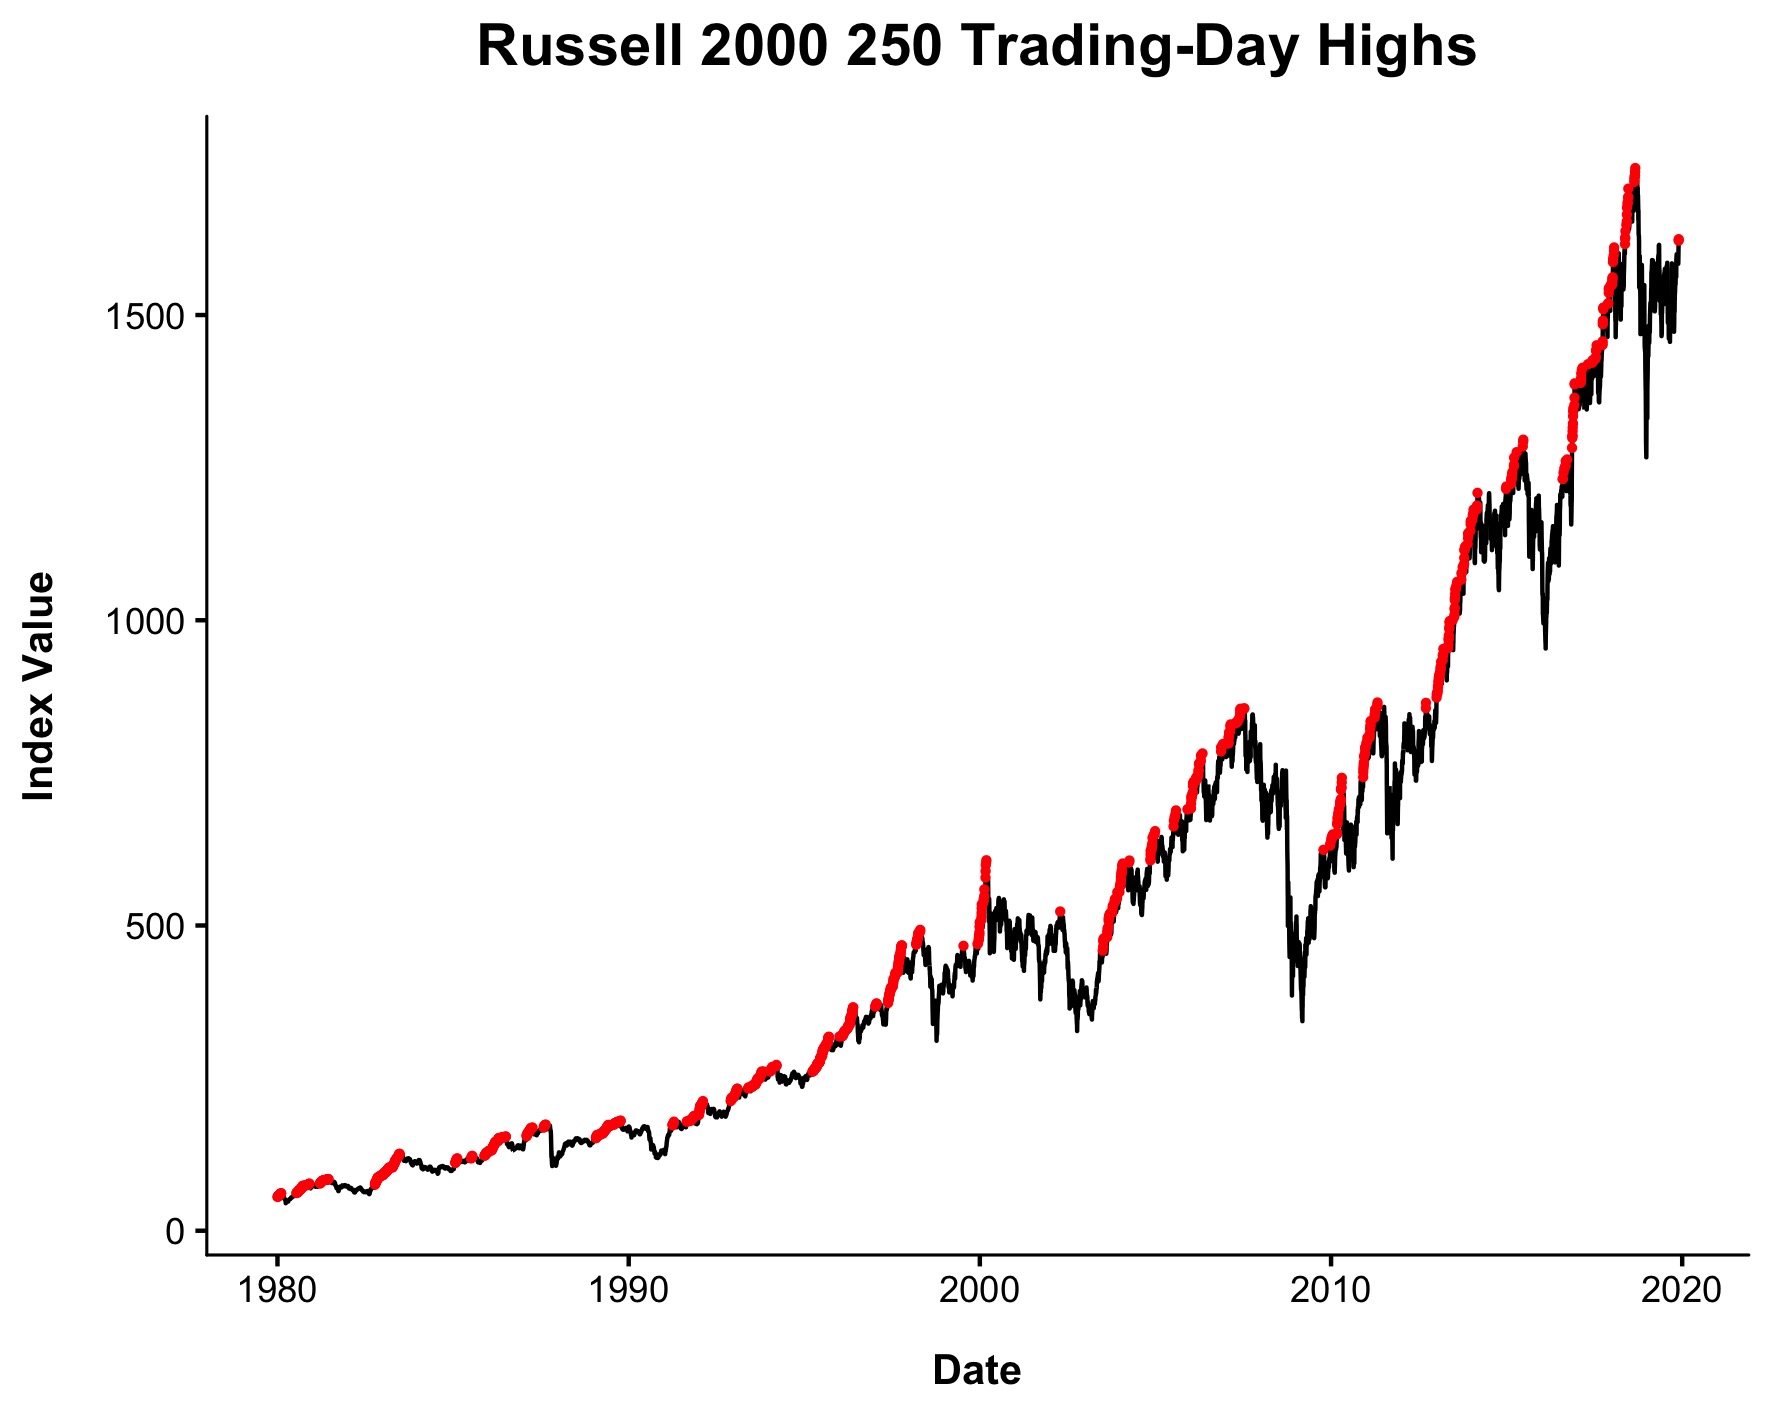
The Russell 2000 is at a 52-week high for the first time since August 2018.
From what we know about momentum, this should be good for forward returns right? Not exactly.
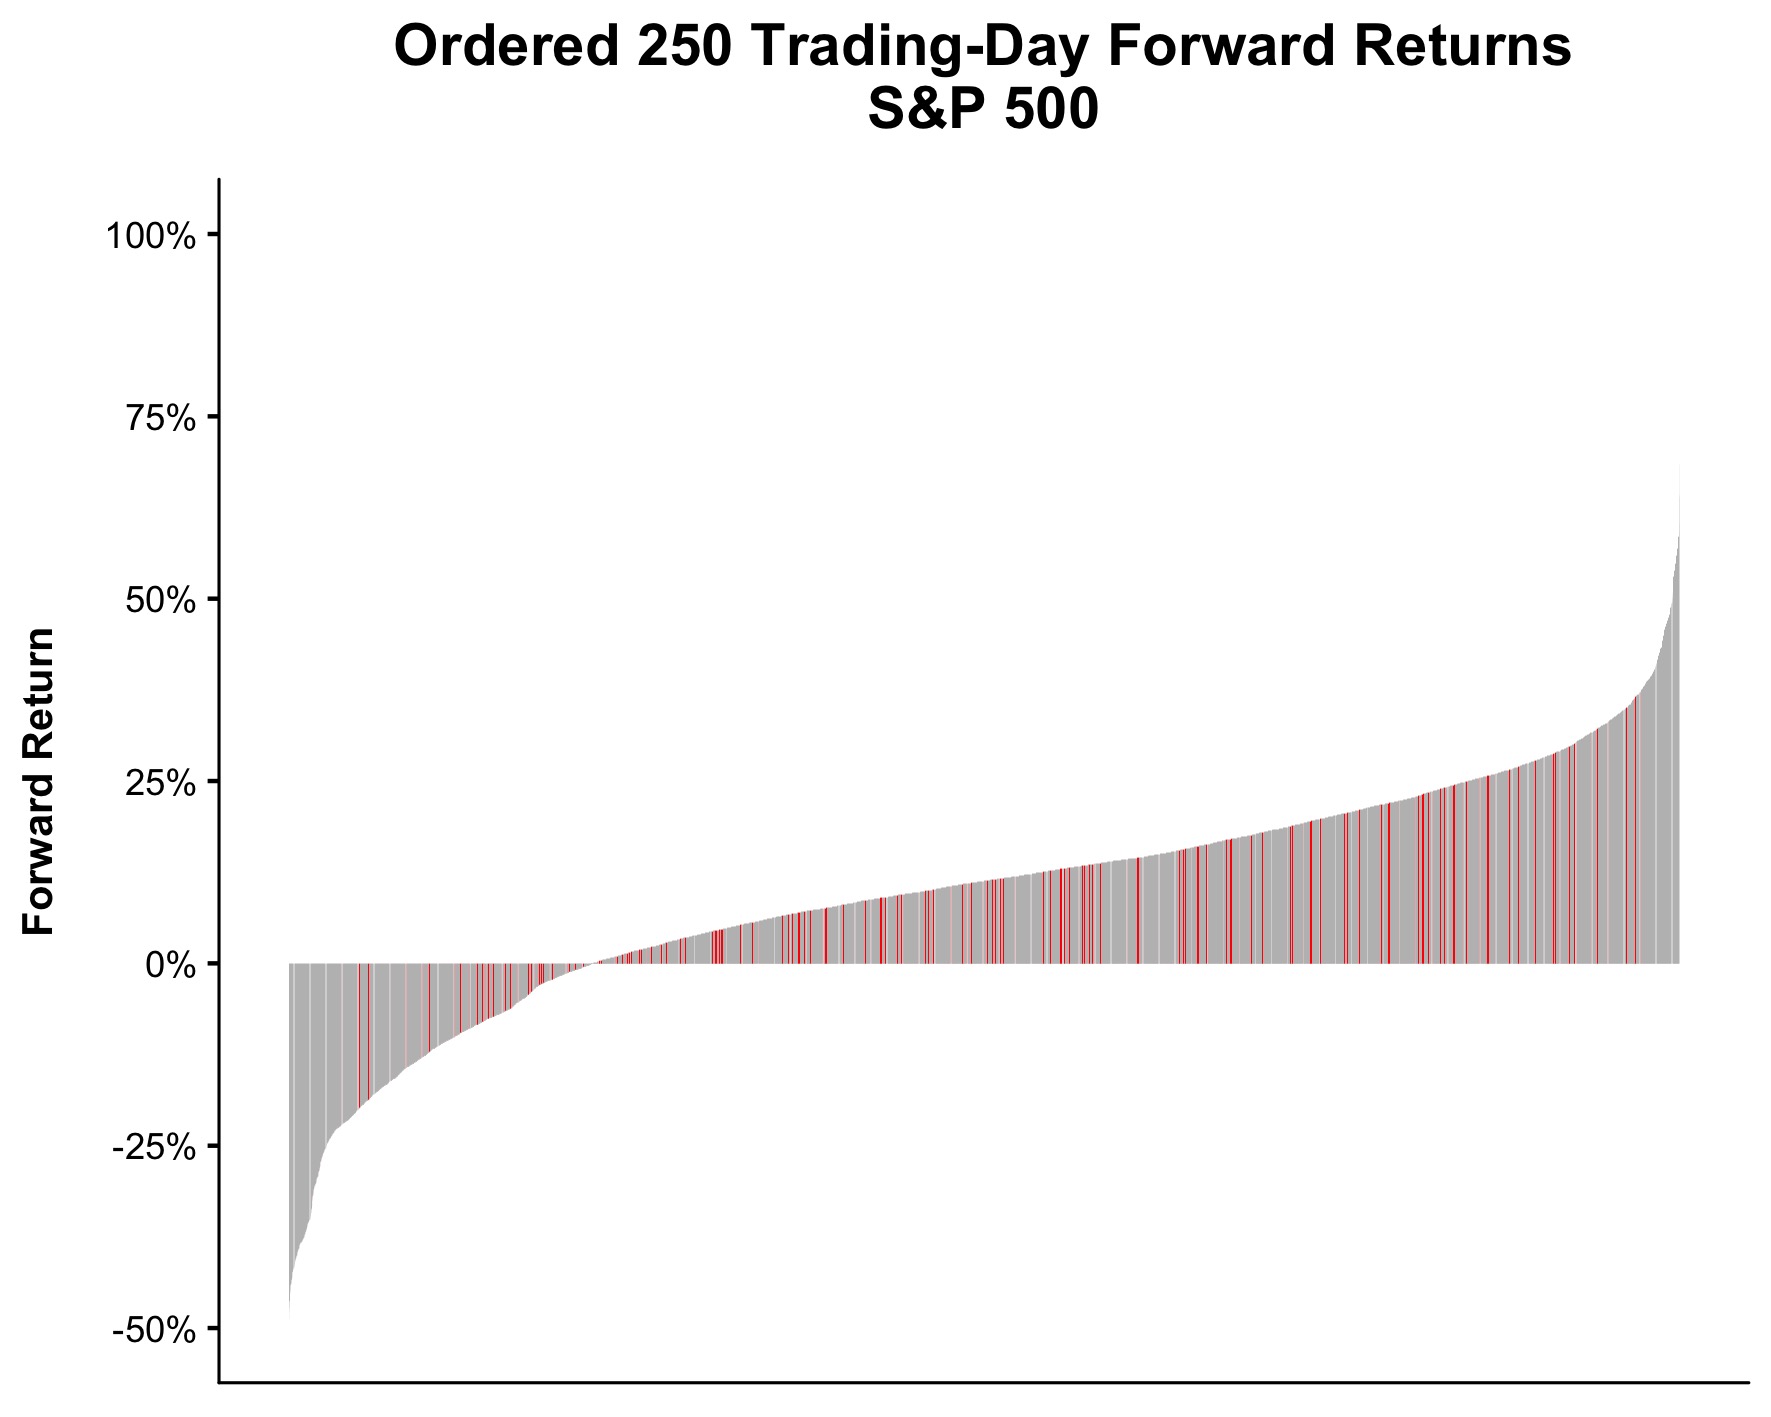
It’s true that large cap stocks tend to do well following a 52-week high. The average 1-year return (price only, since 1978. Data from YCharts) following a 52-week high for the S&P 500 is 10.4%, compared with 9.7% for all days (Red bars represent forward 1-year returns after a 52-week high. Gray is all other days).
However, this does not hold true for small cap stocks. The average 12-month return for the Russell 2000 is 11%, but just 4.9% in the 12-months after hitting an all-time high.
You can see the contrast in the GIF below.
I’m not quite sure what to make of this. To say that these were not the results I was expecting would be an understatement. Anybody have any theories? We checked median numbers and they tell the same story. So do 6-month returns, as opposed to looking at 12-months.
I am thankful to the wonderfully talented Nick Maggiulli who puts these charts together for me. I am wishing everyone a wonderful Thanksgiving with their family.
Michael Batnick is a managing partner at Ritholtz Wealth Management. He is the co-host of Animal Spirits, What Are Your Thoughts, and The Compound and Friends. For disclosure information please see here.
Get a Full Investor Curriculum: Join The Book List
Every month you'll receive 3-4 book suggestions--chosen by hand from more than 1,000 books. You'll also receive an extensive curriculum (books, articles, papers, videos) in PDF form right away.