For the 18th time since the stock market bottomed in 2009, the S&P 500 is more than 5% off its high. The current episode is due to fears over the Coronavirus.

Every time we experience one of these pullbacks, things get noisy on social media, in the news papers, on TV, blogs, radio, everywhere. Why does this always happen, who cares about a 5% pullback?
Most investors would agree that this is normal and not worth paying attention to, but that’s not where their concerns lie. They’re worried about what this might turn into.
The reason noise increases during these episodes is because every time stocks fall a little, there’s always a possibility they fall a lot. What if the virus continues to spread, what if it brings the global economy to a grinding halt, and what if the stock market crashes? This is what investors are worried about.
What are the odds of the stock market crashing? It’s impossible to handicap the future, there are far too many variables to consider, so in attempting to quantify this, all we can do is go back and look at the past.
Over the last hundred years, investors have experienced eight deep drawdowns, as you can see in the chart below.
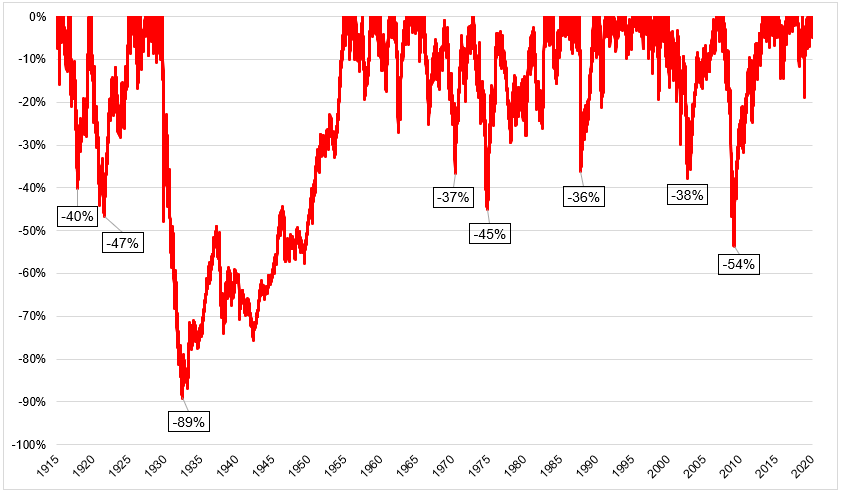
There’s something that always bugged me about this chart, because the depth and magnitude of The Great Depression makes it slightly misleading. It took nearly 25 years to make new highs after the peak in 1929, so it hides the fact that there were two big declines that occurred after the 89% drop.
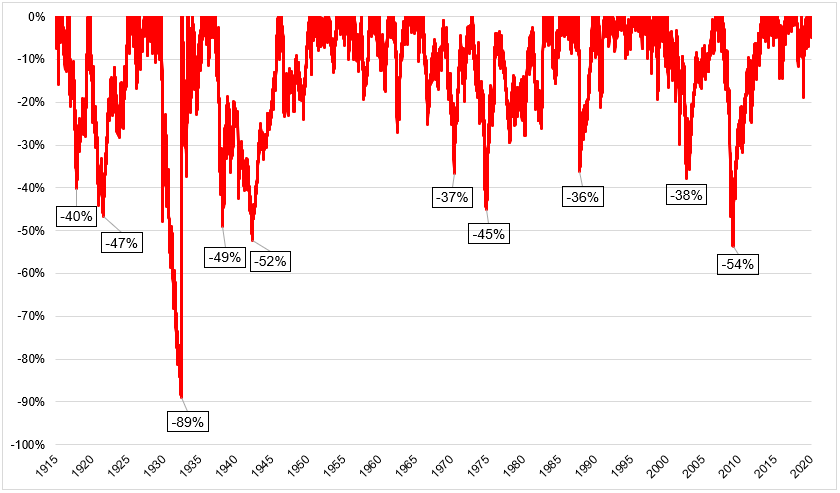
In order to correct for this, I ended the drawdown in 1932 and reset the prices to reveal the declines in 1937 and 1942. This brings us to ten big declines over the last hundred years.
The number of declines tells us little about how often we’re in these periods of drawdown, or the likelihood that they’ve occurred, so I broke this down to get a better sense of what an investor can expect.
I wanted to show this in two different time periods, because I think the depth and magnitude of the depression throws things off a bit. The first column shows from 1915-today, the second one shows from the end of WWII -today, which I think is more representative of markets today.
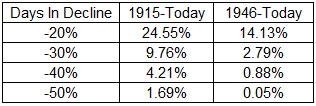
From 1946-today, we have been in a 20% or deeper drawdown on 14.13% of all days, and 30% or deeper drawdown on 2.79% of all days. An alternative way of looking at things tells a similar story. Using rolling three-year returns (this time going all the way back to 1915), there was a 3.6% chance that the market fell 30% or more over a three-year window, a 2.4% chance it fell 40%, and a 2.1% chance it fell 50% or more.
If we know that giant stock market declines happen so infrequently, why do we spend so much mental capital worrying about them? Because we should be worrying about them! Stock market crashes hurt a lot. The crash of 1929 wiped out 30 years of gains. The stock market crash of 1973-1974 took the Dow back to where it was in 1958. At the lows in 2009, the market was trading at prices seen in 1996! It makes sense that investors spend 95% of their energy worrying about something that has happened less than 5% of the time.
So the question is, are stocks going to crash? Unfortunately nobody on earth knows the answer to that. There are no rules for how these things play out, if there were everybody would follow them. The good news is that investors who are worried about deep market declines, and that would be virtually everybody reading this, can take actions to make sure they can survive the big one. We can’t control when the next market crash is going to come, but we can make sure that we’re properly positioned for it.
Risk is directly tied to reward, as you can see in the chart below. The more stock market volatility you can handle, the higher returns you’re going to receive.
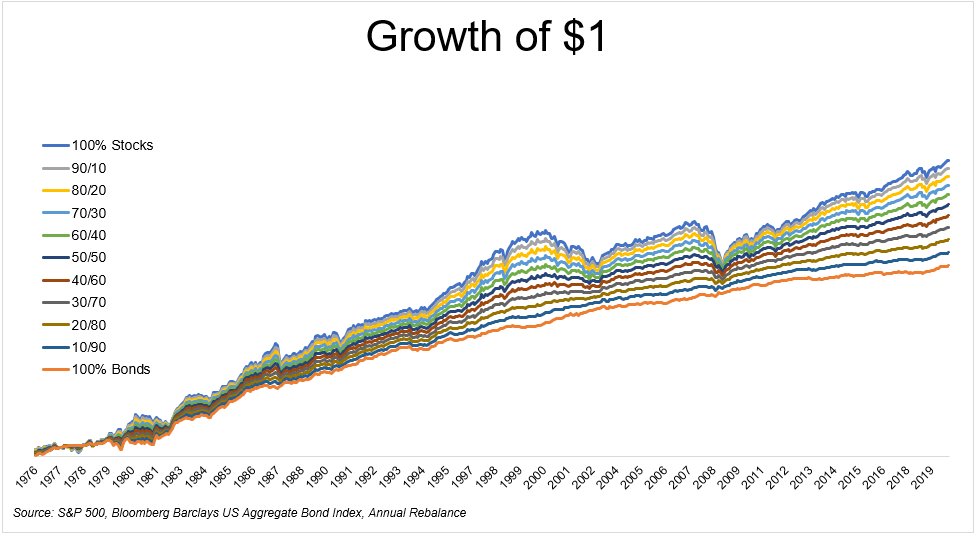
The more you risk, the more you make, and the more you make, the more you have to be willing to lose. There is an amount of pain that you must be willing to bear per unit of risk.
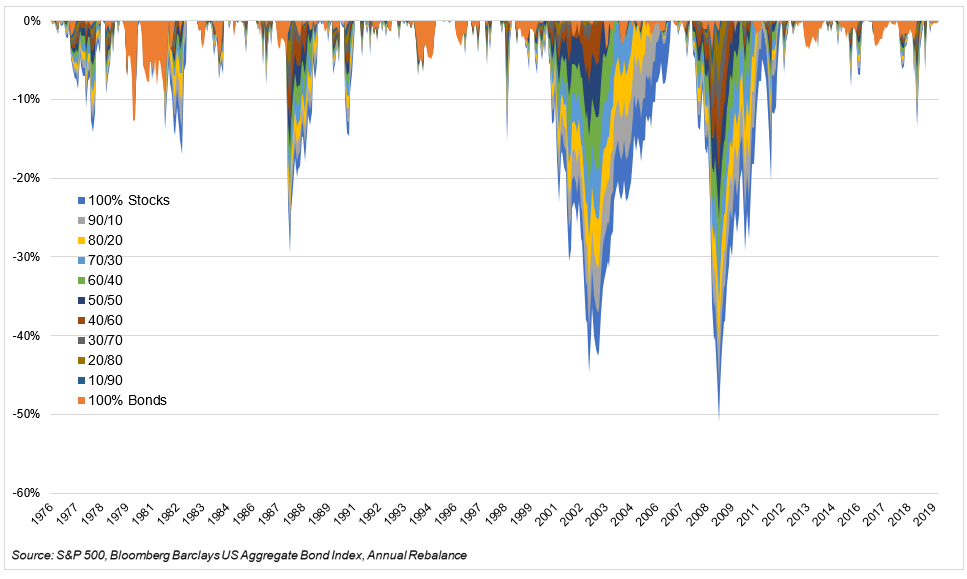
The table below gives a breakdown of what sort of losses you can expect to take at different levels of risk.

The most important thing for investors is to have their risk tolerance properly calibrated. If you have $100,000 invested in a 50/50 portfolio, you should ask yourself, “can I stomach a $25,000 decline? If the answer is no, own more bonds/cash. This doesn’t have to be rocket science, and these decisions should certainly not be made during periods of heightened emotions. You have to prepare for the storm when the skies are blue.
I’m showing the results of a buy and hold portfolio of U.S. stocks and bonds only. Obviously, this is not the only investment option. Some people go for the permanent portfolio, others add commodities, momentum, trend following, or managed futures and other uncorrelated assets, but that’s another conversation for another day.
If you are feeling extremely nervous after the last two days, you’re probably taking too much risk. If you weren’t feeling anything, you can probably afford to take more of it.
You can do all of these mental exercises, but unfortunately the only way you learn where your line is is by crossing it.
The likelihood of a stock market crash is low, but they happen because people are panicking, so it’s perfectly rational to think that you might get caught up in the storm. It’s irrational, to think otherwise. Plan accordingly.

