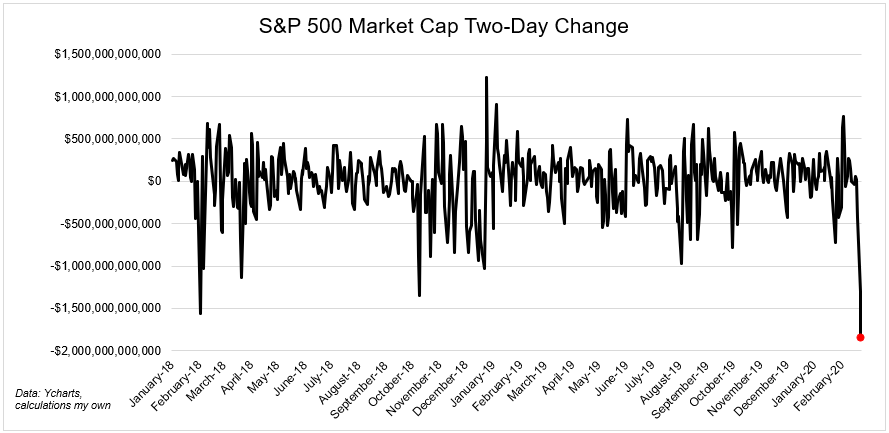
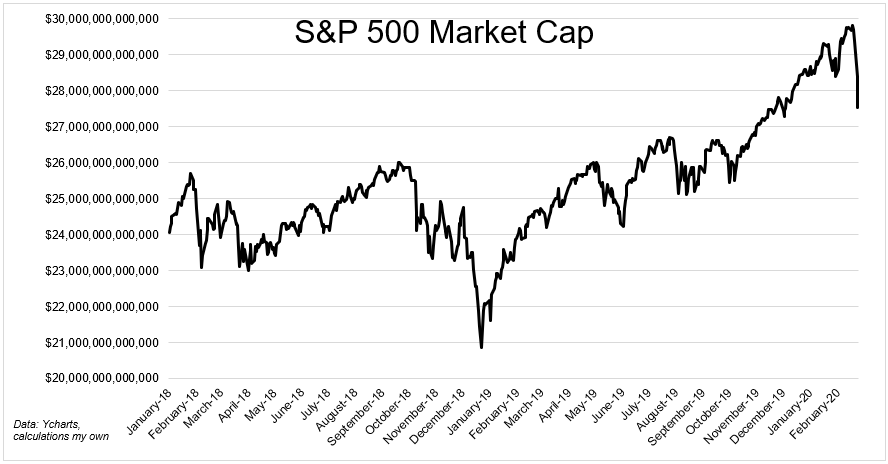
It’s been a rough few days for stocks, as you already know. Over the last two sessions, the S&P 500 shed nearly $2 trillion in market cap, its largest two-day decline ever.
Of course there is a denominator thing going on, stocks were at an all-time high, so naturally a large decline will be a record in dollar terms. In percentage terms, it was the 31st worst 2-day return since 1950. Still pretty gnarly.
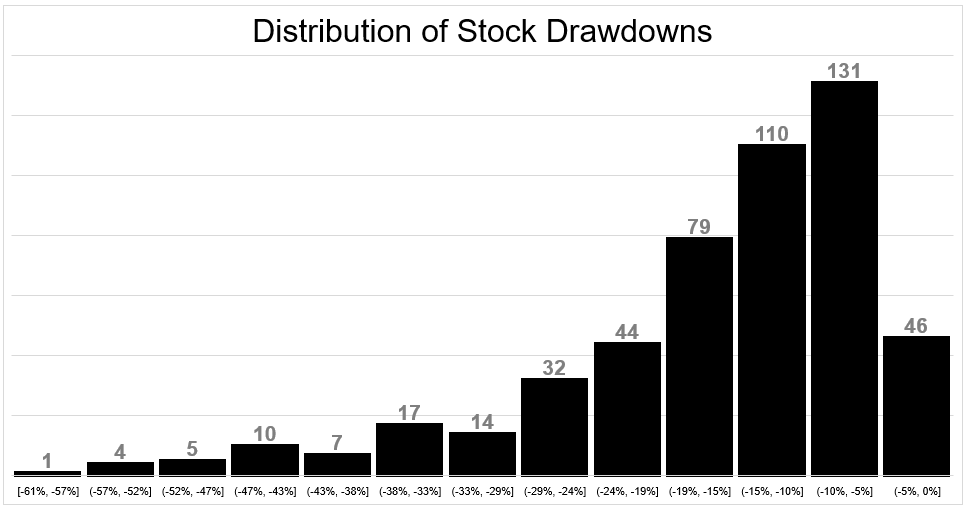
If we look beneath the surface, we see that 126 stocks, or a quarter of the index, are already more than 20% below their 52-week high. The parts always look worse than the sum, but this looks pretty tame compared to recent selloffs. The average S&P 500 stock is 16% off its 52-week high. (median 13%).
When you look at market internals, things like percent of stocks over a short term moving average, or percent of stocks at 10-day high or low, we just had a wash out.
Bad things usually happen in bad markets, so this sharp move lower is unusual in that respect. Steve Deppe tweeted that we just had the worst 4-day stretch to follow an all-time high going back to 1950.
Just 2% of S&P 500 stocks are above their 10-day moving average. Getting back to the unusual nature of this large decline in a rising market, of the 73 previous time that the % of stocks above their 10-day moving average was below 5%, 93% of the time the S&P 500 was already below its 200-day moving average. Today that is not the case, as you can see in the chart below.
The good news is washouts usually mark a short-term bottom.
Jason Goepfert shared a great data point last night on this topic: “We just saw 2 days with 90% of NYSE issues going down,” he said. “When we saw similar 2 day periods of such widespread selling in the past, the S&P 500 rallied every time over the next two months by a median of 7.6%”
The bad news, as I already mentioned, is that this washout comes within the context of an uptrend, meaning its impossible to even begin to say the worst is behind us.
A silver lining of market volatility is it reminds you what your actual tolerance for risk is. It might not be as high as you thought. With the indexes just 7% off their highs, there’s still plenty of time to make the necessary adjustments.
Michael Batnick is a managing partner at Ritholtz Wealth Management. He is the co-host of Animal Spirits, What Are Your Thoughts, and The Compound and Friends. For disclosure information please see here.
Get a Full Investor Curriculum: Join The Book List
Every month you'll receive 3-4 book suggestions--chosen by hand from more than 1,000 books. You'll also receive an extensive curriculum (books, articles, papers, videos) in PDF form right away.