Yesterday was the best day for stocks since 1933. Last Monday was the worst day since Black Monday in 1987. The volatility has been absolutely dizzying. What the hell is going on?
Market professionals know this all too well, but the average citizen watching this might think the market is broken. The market is not broken, it is undergoing a paradigm shift. Buyers and sellers are violently disagreeing on a daily basis on a re-pricing of risk assets, and therefore you’re seeing huge down days followed by huge up days and vice versa. This is what happens in sick markets.
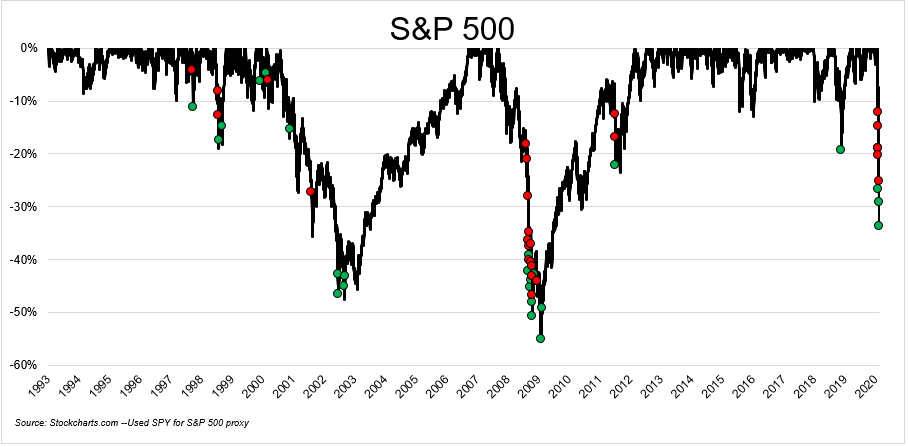
The chart below shows the 25 best and 25 worst days for stocks since 1993* plotted against the drawdown that the market was in when each of these days occurred. Of course bad days happen in bad markets, but so do the best days.
On average, the S&P 500 was in a 33% drawdown during the 25 best days since 1993. The median is -39%! Again, this is during the best days only.
This next chart shows the 30-day standard deviation for stocks. Stating the obvious, a market that falls 11% in one day and rises 9% in another is not healthy.
To hammer home this point, 47 of the 50 best and worst days have occurred while the market was below its 200-day moving average.
If you’re looking for a sign that things are getting better, giant up days are not what you want to see. We can never be sure that we’re out of the woods, but it’s hard to see a return to normal markets until the volatility subsides. Tautological, yes, but as a wise person once said, the beatings will continue until morale improves.
*I planned on doing growth of $1 so I used SPY TR for this. Close enough to SPX.
Michael Batnick is a managing partner at Ritholtz Wealth Management. He is the co-host of Animal Spirits, What Are Your Thoughts, and The Compound and Friends. For disclosure information please see here.
Get a Full Investor Curriculum: Join The Book List
Every month you'll receive 3-4 book suggestions--chosen by hand from more than 1,000 books. You'll also receive an extensive curriculum (books, articles, papers, videos) in PDF form right away.