With the wild swings in the stock and bond market this year, it’s likely that your asset allocation has gotten a bit out of whack. For example, a portfolio that started the year 60/40 (U.S. stock.bond) is now 54/46. This has a lot of people wondering, is now the right time to rebalance?
In this post I’m going to explain what rebalancing is, why investors do it, and explore whether or not there is an optimal time to conduct them.
A portfolio rebalance is simply the act of returning to your pre-determined asset allocation. For most people, this involves at least two asset classes, with an infinite way to slice and dice the portfolio. For the sake of simplicity, I will use only stocks (S&P 500) and bonds (Five-Year U.S. Treasury Notes). These numbers assume perfect execution, no transaction costs, and no taxes.
Asset allocation is all about trade offs. Generally speaking, we expect stocks to outperform bonds, and in return we choose to accept the fact that stocks will be wildly more volatile and have deeper (nominal) drawdowns than bonds. You choose your target based on what sort of returns you need to meet your long-term goals on the one hand, versus how much volatility you can stomach in the short-term on the other.
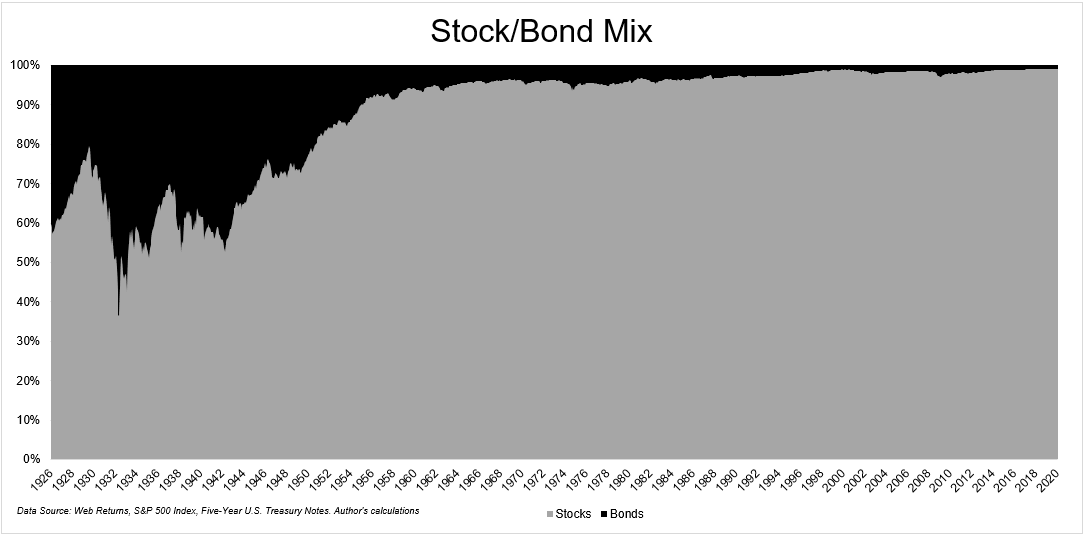
The reason why it makes sense to rebalance a portfolio is because eventually the mix of asset classes will drift away from your initial targets, which ostensibly is your comfort zone. In the case of a 60/40 portfolio, bonds eventually shrank to close to zero, due to the fact that stocks have outperformed bonds to such a great degree.
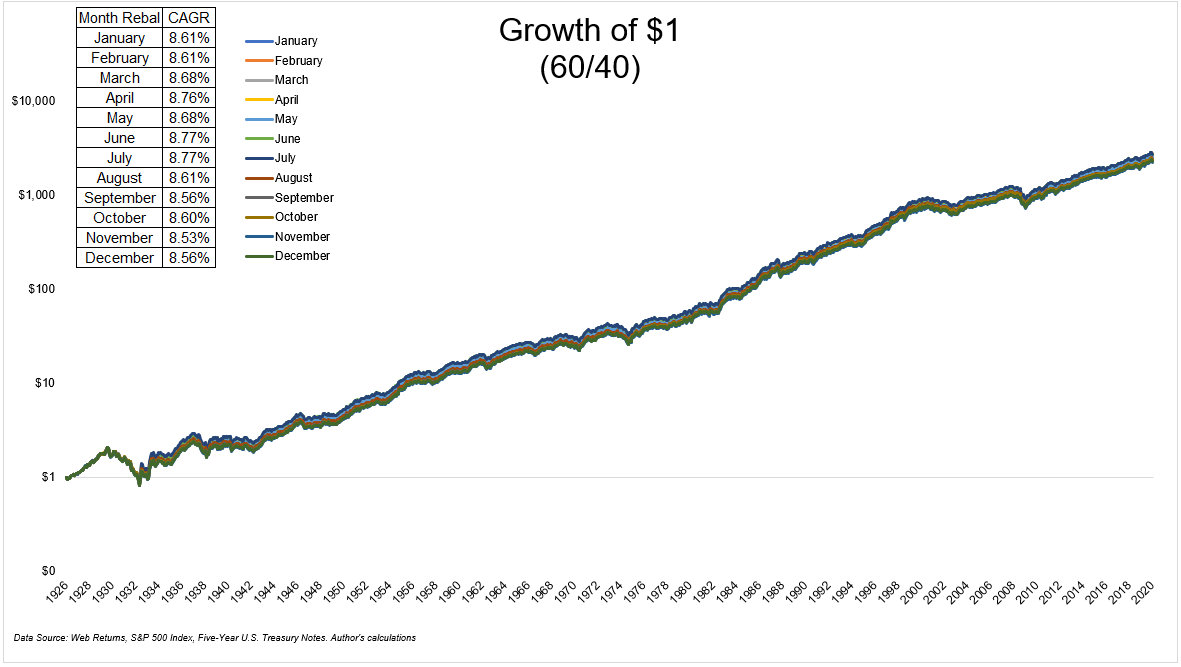
There are a few ways that investors can conduct a rebalance. One of the most common ways is by choosing a date on the calendar. The chart below shows the growth of $1 for a 60/40 portfolio rebalanced every January, every February, and so on. They all end up in about the same spot, as you can see in the table that shows the compound annual growth rates.
The risk profiles are also nearly identical, in terms of how far they declined from their highs.
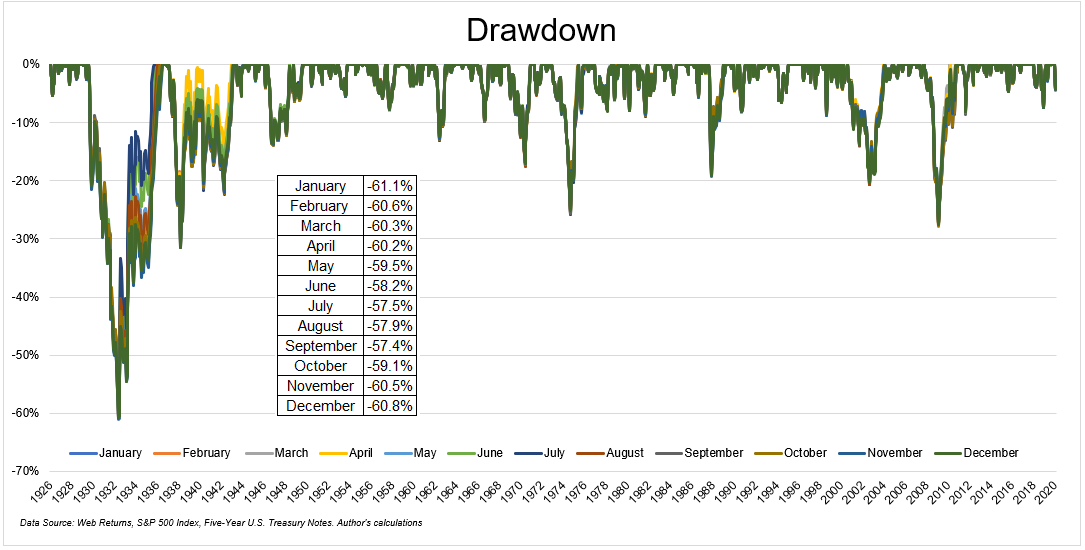
Long-term charts like this, while factually accurate, can often hide the experiences of investors on a day-to-day or even month-to-month basis. Even though these different rebalance dates get an investor to the same destination, the journey might not be identical.
The next chart shows the difference between the most shallow and deepest drawdown based on different monthly rebalancing periods. So to be clear, I did the minimum drawdown (best) minus the maximum drawdown (worst) for each of the series. Outside of the great depression, the journey actually was fairly representative of the final destination. After the Great Depression, the spreads were pretty narrow, even in the best and worst of times. In other words, the decision to rebalance based on the calendar did not make that big of a difference on drawdowns.

Corey Hoffstein does some brilliant work on model specification risk and “timing luck.” Corey has shown this in various strategies, but one particular style that is very sensitive to this phenomenon is trend-following. The decision to be in or out of stocks and by how much is extremely sensitive to different inputs. It’s possible that using a 200-day moving average can have a massive impact over the short-term versus using the 190-day moving average. The destinations are similar, but the journeys can be wildly different.
The same thing does not necessarily occur using a simple stock and bond mix. The reasons for this are fairly obvious, you’re not going in or out, you’re only making changes on the margin. The chart below shows the maximum difference in monthly returns between the 12 different calendar-based portfolios. There was a large amount of dispersion in the Great Depression, but outside of that the spread never got much wider than 2%.

Another common way that investors rebalance their portfolios is by using tolerance bands. For example, a 60/40 portfolio can be rebalanced when the mix is +/-2% away from the original weights. So once stocks are above 62% or below 58%, a rebalance occurs. This did not differ much from the monthly based calendar rebalancing portfolios.
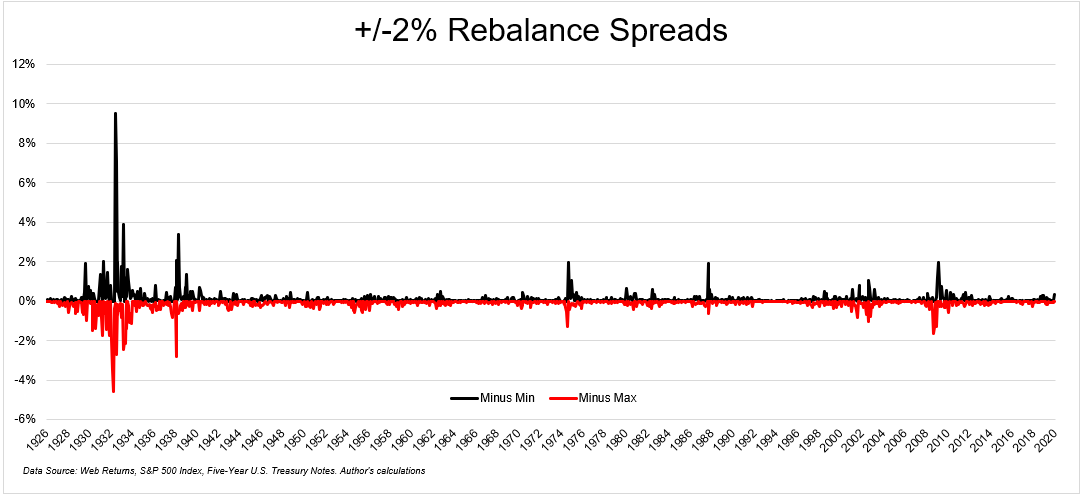
The next chart shows the timing risk from using this strategy versus a calendar rebalance. Again, outside the Great Depression, there was very little risk in terms of using this particular strategy versus a random calendar-based rebalance.
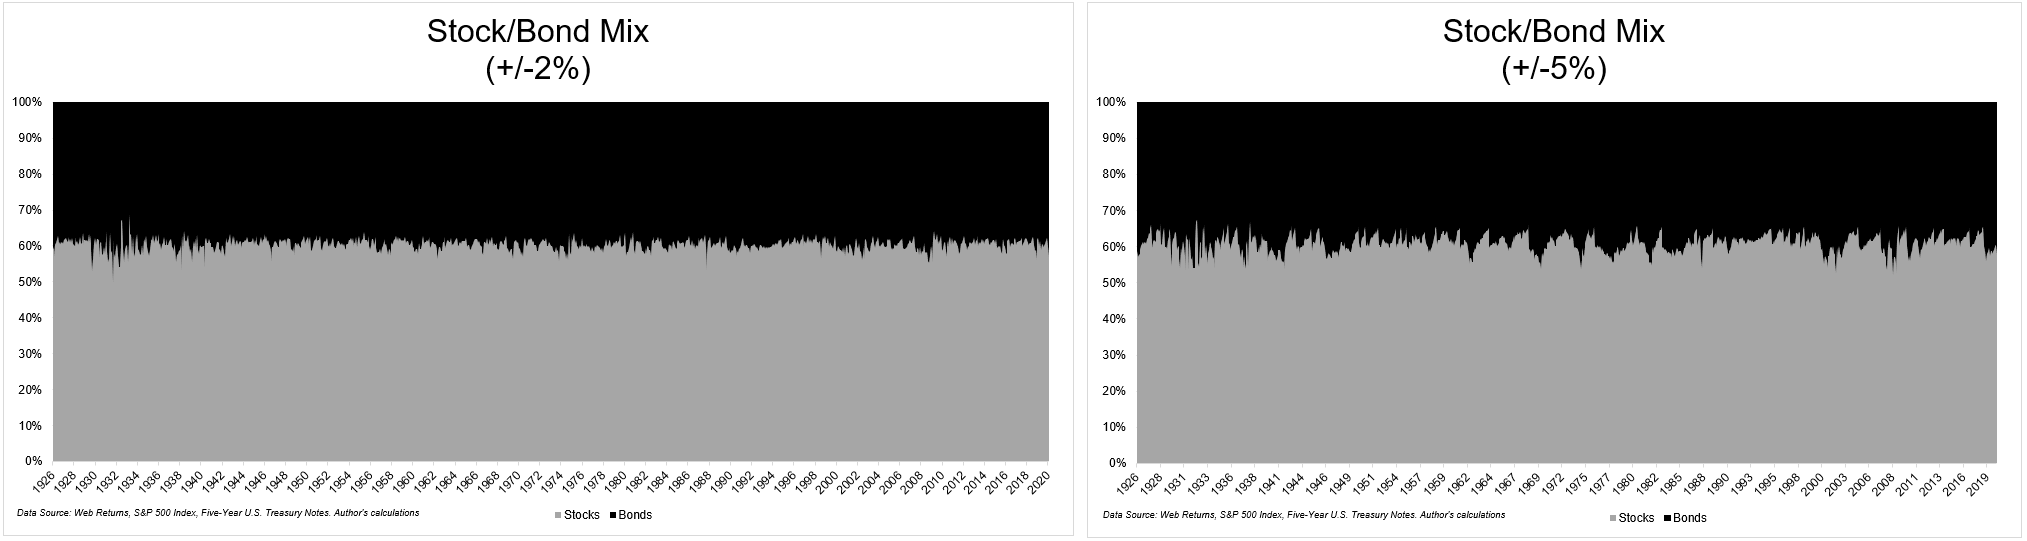
Using a +/-2% tolerance band would have rebalanced every 5.3 months on average. If an investor wants to give the portfolio a little but more room to run, which would reduce activity, they can widen the bands to something like +/-5%. The chart below shows the mix of stocks and bonds with +/-2% bands and +/- 5% bands.
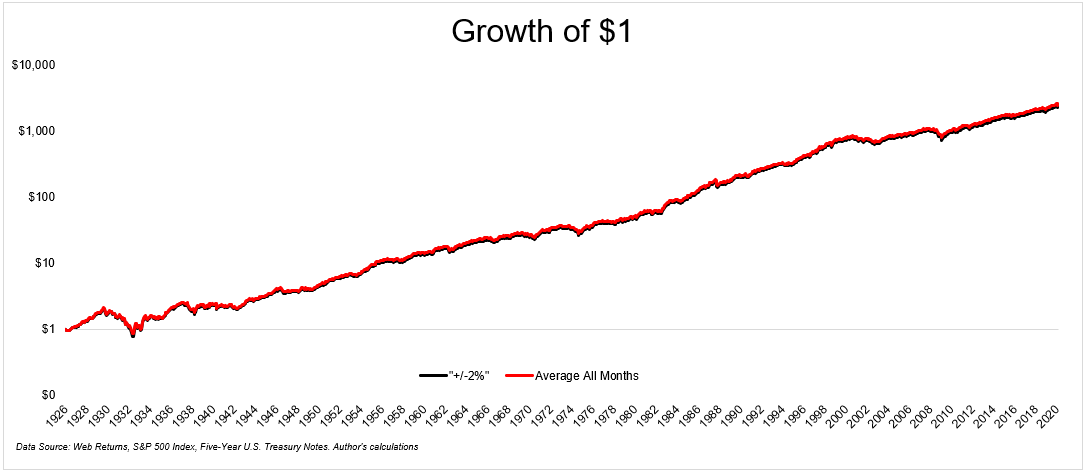
So how did one of these portfolios perform versus the other? They were basically identical, as you can see in the chart below. One of these portfolios did 8.58% annual growth, the other 8.59%. I had to make the red line so thin because otherwise there was a direct overlap. The gray line shows the difference at every point in time between the different rebalancing strategies. At no point in time would you have been much better or worse off by using one versus the other.

Which brings us to today. Is now the right time to rebalance? Let’s look back at the GFC to give us a sense of how different strategies would have performed.
If you were over eager to add to stocks as they were going down from ’07 to the bottom in ’09, your results would have suffered, but not by much. By the end of 2009, you would have ended up with just 1.8% lower than the average of all calendar rebalances. No harm, no foul.
But what if you had a sophisticated plan in place before the wheels fell off? What if you did a rebalance at the first 20% down move in the S&P 500, but you increased your stock exposure by 1% to 61/39? Then when stocks fell 40% you increased it to 62/38. And finally, when they fell 50% you did another 62/38 rebalance. That would have left you near the bottom of the barrel. All that work for no payoff at all. Again, it didn’t crush you, leaving you with just 1.2% less than the average of all calendar based rebalances, but it didn’t help you either.

The best rebalancing strategy during the last deep bear market was to rebalance near the bottom. Stocks bottomed in March, so it’s not terribly surprising that the best months to rebalance were March, April, and February.
Obviously, we’ll only know where the bottom is with the benefit of hindsight. The good news is, as I hope I demonstrated, is that this is not rocket science. You do not have to aim for precision.
Just doing something will get you 95% of the way there.
Don’t overthink this, just come up with a plan and execute.

