The 60/40 portfolio has one of the best track records over the past 50 years.
It has had positive returns 82% of the time over rolling 1-year periods, 93% of the time over rolling 3-year periods, and 99.4% of the time over rolling 5-year periods.
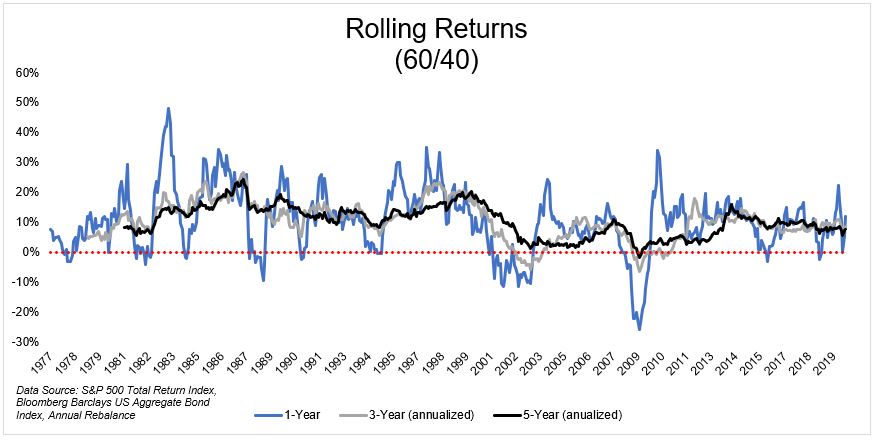
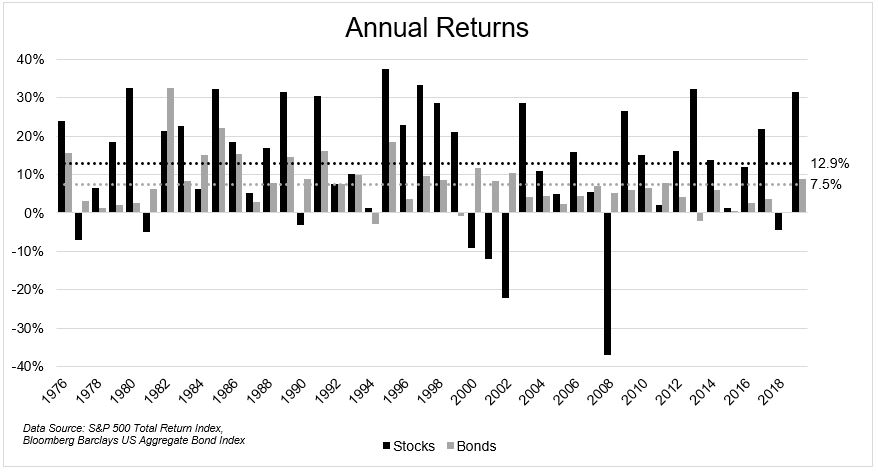
It fell 20% or more in a year just one time, gained 20% or more in a year 10 different times, and had an average annual return of 10.7%.*

The returns were driven not just by stocks, but also by bonds, which had an average annual return of 7.5% from 1976-2019.
Over the last 44 years, it gained over 7,000%, and had a maximum drawdown of just 30%. But that was then, and this is now.
The average ten-year yield over this time was 6.2%. Today it’s 0.69%, which is why it is impossible, not unlikely, impossible that forward returns will match those of the past.
For one, I don’t think anybody in their right mind is expecting large cap US stocks to deliver double digit returns given their recent performance and current valuation. More importantly, what makes this performance impossible to replicate is the fact that bonds are now in all likelihood going to give you less than 2% a year.
It’s for this reason that Jeremy Siegel suggests that 75/25 is the new 60/40. Unfortunately, even a portfolio that takes on more risk is highly unlikely to match the returns we’ve seen in the past.
A simple way to think about about where stock market performance comes from is to break it down into three variables- the earnings yield (inverse of the P/E ratio), the dividend yield, and the change in multiple.
Using the S&P 500 as a proxy for stocks, the earnings yield and dividend yield get you roughly to a 6% rate of return. The change in multiples is the ultimate wild card here, but I can’t with a straight face that we should expect to see this expand or contribute to returns over the next ten years. Said differently, if I had to bet, I’d say that multiple compression will be a drag on returns. For this exercise let’s just generously assume that the multiple remains unchanged. Using this admittedly naive model, we’ll use 6% as an approximate rate of return for stocks.
Bonds are a much simpler story. The best predictor of future bond returns are current rates. Let’s use 2%, which is more than a little generous here.
Putting this altogether, a 60/40 gets you 4.6%, significantly lower than the 10.7% average annual return. Even using 75/25 bumps you up to a little over 5%, less than half the historical rate. With bonds doing 2%, allocating 75% of your portfolio to stocks, they would need to do 14% a year in order to achieve the 10.7% average annual return that a 60/40 portfolio delivered ¯\_(ツ)_/¯
So what is an investor to do?
You can consider stocks that haven’t performed as well, like value, emerging markets, or foreign developed countries.
You can consider other asset classes like gold, commodities, or bitcoin.
You can consider other strategies like venture capital, private equity, or private real estate.
You can try to outperform the index.
All of these might help you outperform, but unfortunately you’re not the only one with this idea.
I wish there were easy solutions to this problem. There aren’t. This is the world we live in.
The best answer for most people, the answer that nobody (including myself) wants to hear, is to simply prepare for lower returns. Accepting lower returns is a better idea for most people than refusing to accept low returns and swinging for the fences in order to bridge the gap.
*It’s important to mention that transaction costs to get into a portfolio like this easily could have run 2% or more prior to the advent of low-cost index funds.

