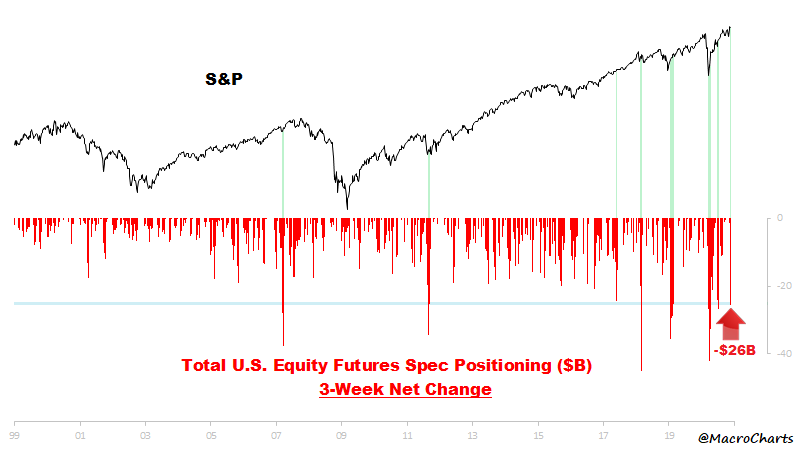
There’s Always a Chart

If you’re looking for evidence that shorts have thrown in the towel, and therefore now’s the time to get cautious, there’s a chart for that.

If you’re looking for evidence that actually, an absence of bears doesn’t mean an overwhelming amount of bulls, there’s a chart for that too.

In this tweet from @MacroCharts, he writes:

Equity Futures traders have cut exposure aggressively – even as $SPX broke to new highs. The 3-week positioning change is one of the most negative in history – only seen at bottoms, and once when the market was at a high (2017).”

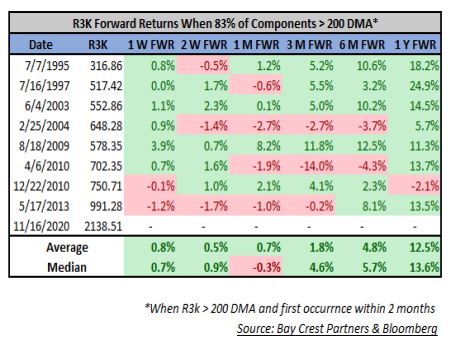
If you’re looking for evidence that strong breadth is bullish and not bearish, you guessed it; there’s a chart for that too. Here’s Jonathan Krinsky in his note from over the weekend.

“We have seen a handful of similar ‘booster shots’ over the last 25 years and while the near-term returns have been mixed, the important aspect is that none of them marked a meaningful market top.”

If you’re looking for something to confirm your view, you’re going to find it. Whether it’s a data point that supports your ideas or a contra data point that negates it, thereby making you even more confident, then you’re going to find that too.

We’re all guilty of seeing the world as we want it to be. It’s hard to hack our software, no matter how many Charlie Munger quotes you throw out there. “Invert, always invert” seems like a logical one here. The best we can do is make sure that we never rely on a single data point to tell an entire story.

This content, which contains security-related opinions and/or information, is provided for informational purposes only and should not be relied upon in any manner as professional advice, or an endorsement of any practices, products or services. There can be no guarantees or assurances that the views expressed here will be applicable for any particular facts or circumstances, and should not be relied upon in any manner. You should consult your own advisers as to legal, business, tax, and other related matters concerning any investment.

The commentary in this “post” (including any related blog, podcasts, videos, and social media) reflects the personal opinions, viewpoints, and analyses of the Ritholtz Wealth Management employees providing such comments, and should not be regarded the views of Ritholtz Wealth Management LLC. or its respective affiliates or as a description of advisory services provided by Ritholtz Wealth Management or performance returns of any Ritholtz Wealth Management Investments client.

References to any securities or digital assets, or performance data, are for illustrative purposes only and do not constitute an investment recommendation or offer to provide investment advisory services. Charts and graphs provided within are for informational purposes solely and should not be relied upon when making any investment decision. Past performance is not indicative of future results. The content speaks only as of the date indicated. Any projections, estimates, forecasts, targets, prospects, and/or opinions expressed in these materials are subject to change without notice and may differ or be contrary to opinions expressed by others.

The Compound Media, Inc., an affiliate of Ritholtz Wealth Management, receives payment from various entities for advertisements in affiliated podcasts, blogs and emails. Inclusion of such advertisements does not constitute or imply endorsement, sponsorship or recommendation thereof, or any affiliation therewith, by the Content Creator or by Ritholtz Wealth Management or any of its employees. Investments in securities involve the risk of loss. For additional advertisement disclaimers see here: https://www.ritholtzwealth.com/advertising-disclaimers

Please see disclosures here.